
 Yahoo Finance
 Returns On Capital At J.B. Hunt Transport Services (NASDAQ:JBHT) Have Hit The Brakes
If you're not sure where to start when looking for the next multi-bagger, there are a few key trends you should keep an eye out for. Typically, we'll want to notice a trend of growing return on capital employed (ROCE) and alongside that, an expanding base of capital employed. Put simply, these types of businesses are compounding machines, meaning they are continually reinvesting their earnings at ever-higher rates of return. That's why when we briefly looked at J.B. Hunt Transport Services' (NASDAQ:JBHT) ROCE trend, we were pretty happy with what we saw.
What Is Return On Capital Employed (ROCE)?
If you haven't worked with ROCE before, it measures the 'return' (pre-tax profit) a company generates from capital employed in its business. To calculate this metric for J.B. Hunt Transport Services, this is the formula:
Return on Capital Employed = Earnings Before Interest and Tax (EBIT) ÷ (Total Assets - Current Liabilities)
0.13 = US$910m ÷ (US$8.4b - US$1.5b) (Based on the trailing twelve months to March 2024).
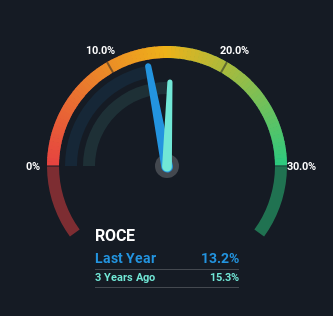
Thus, J.B. Hunt Transport Services has an ROCE of 13%. In absolute terms, that's a satisfactory return, but compared to the Transportation industry average of 8.2% it's much better.
See our latest analysis for J.B. Hunt Transport Services
In the above chart we have measured J.B. Hunt Transport Services' prior ROCE against its prior performance, but the future is arguably more important. If you'd like to see what analysts are forecasting going forward, you should check out our free analyst report for J.B. Hunt Transport Services .
So How Is J.B. Hunt Transport Services' ROCE Trending?
While the returns on capital are good, they haven't moved much. The company has employed 59% more capital in the last five years, and the returns on that capital have remained stable at 13%. Since 13% is a moderate ROCE though, it's good to see a business can continue to reinvest at these decent rates of return. Over long periods of time, returns like these might not be too exciting, but with consistency they can pay off in terms of share price returns.
The Key Takeaway
In the end, J.B. Hunt Transport Services has proven its ability to adequately reinvest capital at good rates of return. Therefore it's no surprise that shareholders have earned a respectable 94% return if they held over the last five years. So while investors seem to be recognizing these promising trends, we still believe the stock deserves further research.
One more thing to note, we've identified 1 warning sign with J.B. Hunt Transport Services and understanding it should be part of your investment process.
For those who like to invest in solid companies, check out this free list of companies with solid balance sheets and high returns on equity.
Have feedback on this article? Concerned about the content? Get in touch with us directly. Alternatively, email editorial-team (at) simplywallst.com.
This article by Simply Wall St is general in nature. We provide commentary based on historical data and analyst forecasts only using an unbiased methodology and our articles are not intended to be financial advice. It does not constitute a recommendation to buy or sell any stock, and does not take account of your objectives, or your financial situation. We aim to bring you long-term focused analysis driven by fundamental data. Note that our analysis may not factor in the latest price-sensitive company announcements or qualitative material. Simply Wall St has no position in any stocks mentioned.
