
 Yahoo Finance
 Returns On Capital At Kingsmen Creatives (SGX:5MZ) Have Hit The Brakes
Finding a business that has the potential to grow substantially is not easy, but it is possible if we look at a few key financial metrics. Firstly, we'd want to identify a growing return on capital employed (ROCE) and then alongside that, an ever-increasing base of capital employed. This shows us that it's a compounding machine, able to continually reinvest its earnings back into the business and generate higher returns. Although, when we looked at Kingsmen Creatives (SGX:5MZ), it didn't seem to tick all of these boxes.
Understanding Return On Capital Employed (ROCE)
If you haven't worked with ROCE before, it measures the 'return' (pre-tax profit) a company generates from capital employed in its business. Analysts use this formula to calculate it for Kingsmen Creatives:
Return on Capital Employed = Earnings Before Interest and Tax (EBIT) ÷ (Total Assets - Current Liabilities)
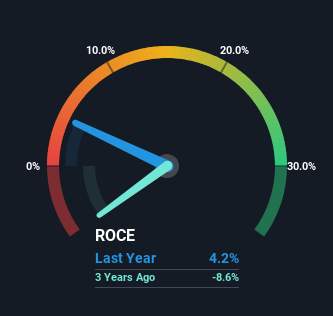
0.042 = S$5.2m ÷ (S$242m - S$119m) (Based on the trailing twelve months to June 2023).
So, Kingsmen Creatives has an ROCE of 4.2%. Ultimately, that's a low return and it under-performs the Professional Services industry average of 13%.
See our latest analysis for Kingsmen Creatives
While the past is not representative of the future, it can be helpful to know how a company has performed historically, which is why we have this chart above. If you're interested in investigating Kingsmen Creatives' past further, check out this free graph of past earnings, revenue and cash flow.
How Are Returns Trending?
Things have been pretty stable at Kingsmen Creatives, with its capital employed and returns on that capital staying somewhat the same for the last five years. This tells us the company isn't reinvesting in itself, so it's plausible that it's past the growth phase. So don't be surprised if Kingsmen Creatives doesn't end up being a multi-bagger in a few years time.
Another thing to note, Kingsmen Creatives has a high ratio of current liabilities to total assets of 49%. This can bring about some risks because the company is basically operating with a rather large reliance on its suppliers or other sorts of short-term creditors. While it's not necessarily a bad thing, it can be beneficial if this ratio is lower.
The Bottom Line On Kingsmen Creatives' ROCE
In a nutshell, Kingsmen Creatives has been trudging along with the same returns from the same amount of capital over the last five years. Since the stock has declined 37% over the last five years, investors may not be too optimistic on this trend improving either. Therefore based on the analysis done in this article, we don't think Kingsmen Creatives has the makings of a multi-bagger.
One final note, you should learn about the 4 warning signs we've spotted with Kingsmen Creatives (including 1 which is a bit unpleasant) .
If you want to search for solid companies with great earnings, check out this free list of companies with good balance sheets and impressive returns on equity.
Have feedback on this article? Concerned about the content? Get in touch with us directly. Alternatively, email editorial-team (at) simplywallst.com.
This article by Simply Wall St is general in nature. We provide commentary based on historical data and analyst forecasts only using an unbiased methodology and our articles are not intended to be financial advice. It does not constitute a recommendation to buy or sell any stock, and does not take account of your objectives, or your financial situation. We aim to bring you long-term focused analysis driven by fundamental data. Note that our analysis may not factor in the latest price-sensitive company announcements or qualitative material. Simply Wall St has no position in any stocks mentioned.
