
 Yahoo Finance
 Returns On Capital At Knights Group Holdings (LON:KGH) Paint An Interesting Picture
Finding a business that has the potential to grow substantially is not easy, but it is possible if we look at a few key financial metrics. Ideally, a business will show two trends; firstly a growing return on capital employed (ROCE) and secondly, an increasing amount of capital employed. Basically this means that a company has profitable initiatives that it can continue to reinvest in, which is a trait of a compounding machine. In light of that, when we looked at Knights Group Holdings (LON:KGH) and its ROCE trend, we weren't exactly thrilled.
Understanding Return On Capital Employed (ROCE)
For those who don't know, ROCE is a measure of a company's yearly pre-tax profit (its return), relative to the capital employed in the business. To calculate this metric for Knights Group Holdings, this is the formula:
Return on Capital Employed = Earnings Before Interest and Tax (EBIT) ÷ (Total Assets - Current Liabilities)
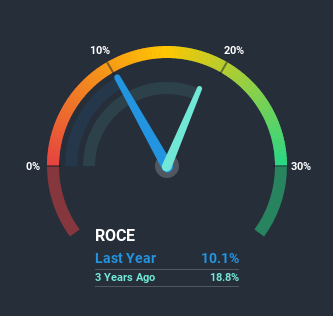
0.10 = UK£13m ÷ (UK£160m - UK£29m) (Based on the trailing twelve months to April 2020).
Thus, Knights Group Holdings has an ROCE of 10%. That's a relatively normal return on capital, and it's around the 12% generated by the Professional Services industry.
Check out our latest analysis for Knights Group Holdings
In the above chart we have measured Knights Group Holdings' prior ROCE against its prior performance, but the future is arguably more important. If you'd like, you can check out the forecasts from the analysts covering Knights Group Holdings here for free.
What Can We Tell From Knights Group Holdings' ROCE Trend?
Unfortunately, the trend isn't great with ROCE falling from 46% four years ago, while capital employed has grown 1,438%. That being said, Knights Group Holdings raised some capital prior to their latest results being released, so that could partly explain the increase in capital employed. It's unlikely that all of the funds raised have been put to work yet, so as a consequence Knights Group Holdings might not have received a full period of earnings contribution from it.
On a related note, Knights Group Holdings has decreased its current liabilities to 18% of total assets. Since the ratio used to be 75%, that's a significant reduction and it no doubt explains the drop in ROCE. What's more, this can reduce some aspects of risk to the business because now the company's suppliers or short-term creditors are funding less of its operations. Since the business is basically funding more of its operations with it's own money, you could argue this has made the business less efficient at generating ROCE.
Our Take On Knights Group Holdings' ROCE
In summary, despite lower returns in the short term, we're encouraged to see that Knights Group Holdings is reinvesting for growth and has higher sales as a result. And the stock has followed suit returning a meaningful 16% to shareholders over the last year. So while the underlying trends could already be accounted for by investors, we still think this stock is worth looking into further.
One more thing to note, we've identified 3 warning signs with Knights Group Holdings and understanding these should be part of your investment process.
If you want to search for solid companies with great earnings, check out this free list of companies with good balance sheets and impressive returns on equity.
This article by Simply Wall St is general in nature. It does not constitute a recommendation to buy or sell any stock, and does not take account of your objectives, or your financial situation. We aim to bring you long-term focused analysis driven by fundamental data. Note that our analysis may not factor in the latest price-sensitive company announcements or qualitative material. Simply Wall St has no position in any stocks mentioned.
Have feedback on this article? Concerned about the content? Get in touch with us directly. Alternatively, email editorial-team (at) simplywallst.com.
