
 Yahoo Finance
 Returns On Capital At Midwich Group (LON:MIDW) Paint A Concerning Picture
There are a few key trends to look for if we want to identify the next multi-bagger. Amongst other things, we'll want to see two things; firstly, a growing return on capital employed (ROCE) and secondly, an expansion in the company's amount of capital employed. This shows us that it's a compounding machine, able to continually reinvest its earnings back into the business and generate higher returns. However, after briefly looking over the numbers, we don't think Midwich Group (LON:MIDW) has the makings of a multi-bagger going forward, but let's have a look at why that may be.
Return On Capital Employed (ROCE): What Is It?
If you haven't worked with ROCE before, it measures the 'return' (pre-tax profit) a company generates from capital employed in its business. To calculate this metric for Midwich Group, this is the formula:
Return on Capital Employed = Earnings Before Interest and Tax (EBIT) ÷ (Total Assets - Current Liabilities)
0.13 = UK£43m ÷ (UK£654m - UK£314m) (Based on the trailing twelve months to December 2023).
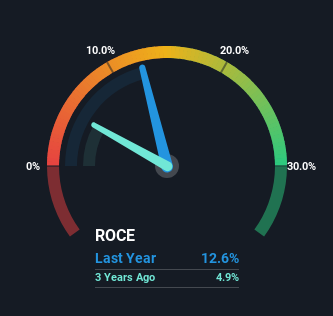
So, Midwich Group has an ROCE of 13%. By itself that's a normal return on capital and it's in line with the industry's average returns of 13%.
Check out our latest analysis for Midwich Group
Above you can see how the current ROCE for Midwich Group compares to its prior returns on capital, but there's only so much you can tell from the past. If you're interested, you can view the analysts predictions in our free analyst report for Midwich Group .
What The Trend Of ROCE Can Tell Us
On the surface, the trend of ROCE at Midwich Group doesn't inspire confidence. Over the last five years, returns on capital have decreased to 13% from 29% five years ago. On the other hand, the company has been employing more capital without a corresponding improvement in sales in the last year, which could suggest these investments are longer term plays. It may take some time before the company starts to see any change in earnings from these investments.
On a related note, Midwich Group has decreased its current liabilities to 48% of total assets. So we could link some of this to the decrease in ROCE. Effectively this means their suppliers or short-term creditors are funding less of the business, which reduces some elements of risk. Some would claim this reduces the business' efficiency at generating ROCE since it is now funding more of the operations with its own money. Keep in mind 48% is still pretty high, so those risks are still somewhat prevalent.
Our Take On Midwich Group's ROCE
In summary, Midwich Group is reinvesting funds back into the business for growth but unfortunately it looks like sales haven't increased much just yet. And investors appear hesitant that the trends will pick up because the stock has fallen 26% in the last five years. In any case, the stock doesn't have these traits of a multi-bagger discussed above, so if that's what you're looking for, we think you'd have more luck elsewhere.
On a separate note, we've found 3 warning signs for Midwich Group you'll probably want to know about.
While Midwich Group may not currently earn the highest returns, we've compiled a list of companies that currently earn more than 25% return on equity. Check out this free list here.
Have feedback on this article? Concerned about the content? Get in touch with us directly. Alternatively, email editorial-team (at) simplywallst.com.
This article by Simply Wall St is general in nature. We provide commentary based on historical data and analyst forecasts only using an unbiased methodology and our articles are not intended to be financial advice. It does not constitute a recommendation to buy or sell any stock, and does not take account of your objectives, or your financial situation. We aim to bring you long-term focused analysis driven by fundamental data. Note that our analysis may not factor in the latest price-sensitive company announcements or qualitative material. Simply Wall St has no position in any stocks mentioned.
