
 Yahoo Finance
 Returns On Capital At Nick Scali (ASX:NCK) Paint A Concerning Picture
Did you know there are some financial metrics that can provide clues of a potential multi-bagger? Amongst other things, we'll want to see two things; firstly, a growing return on capital employed (ROCE) and secondly, an expansion in the company's amount of capital employed. Ultimately, this demonstrates that it's a business that is reinvesting profits at increasing rates of return. So while Nick Scali (ASX:NCK) has a high ROCE right now, lets see what we can decipher from how returns are changing.
Return On Capital Employed (ROCE): What Is It?
For those that aren't sure what ROCE is, it measures the amount of pre-tax profits a company can generate from the capital employed in its business. To calculate this metric for Nick Scali, this is the formula:
Return on Capital Employed = Earnings Before Interest and Tax (EBIT) ÷ (Total Assets - Current Liabilities)
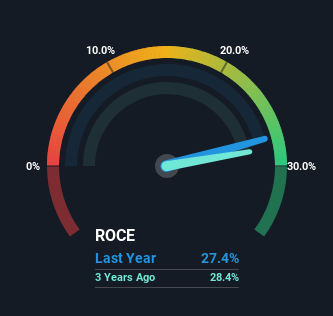
0.27 = AU$128m ÷ (AU$600m - AU$133m) (Based on the trailing twelve months to December 2023).
So, Nick Scali has an ROCE of 27%. That's a fantastic return and not only that, it outpaces the average of 18% earned by companies in a similar industry.
View our latest analysis for Nick Scali
In the above chart we have measured Nick Scali's prior ROCE against its prior performance, but the future is arguably more important. If you'd like to see what analysts are forecasting going forward, you should check out our free analyst report for Nick Scali .
What Can We Tell From Nick Scali's ROCE Trend?
In terms of Nick Scali's historical ROCE movements, the trend isn't fantastic. Historically returns on capital were even higher at 56%, but they have dropped over the last five years. Given the business is employing more capital while revenue has slipped, this is a bit concerning. This could mean that the business is losing its competitive advantage or market share, because while more money is being put into ventures, it's actually producing a lower return - "less bang for their buck" per se.
On a related note, Nick Scali has decreased its current liabilities to 22% of total assets. So we could link some of this to the decrease in ROCE. What's more, this can reduce some aspects of risk to the business because now the company's suppliers or short-term creditors are funding less of its operations. Since the business is basically funding more of its operations with it's own money, you could argue this has made the business less efficient at generating ROCE.
The Bottom Line
In summary, we're somewhat concerned by Nick Scali's diminishing returns on increasing amounts of capital. Since the stock has skyrocketed 235% over the last five years, it looks like investors have high expectations of the stock. Regardless, we don't feel too comfortable with the fundamentals so we'd be steering clear of this stock for now.
On a final note, we've found 1 warning sign for Nick Scali that we think you should be aware of.
Nick Scali is not the only stock earning high returns. If you'd like to see more, check out our free list of companies earning high returns on equity with solid fundamentals.
Have feedback on this article? Concerned about the content? Get in touch with us directly. Alternatively, email editorial-team (at) simplywallst.com.
This article by Simply Wall St is general in nature. We provide commentary based on historical data and analyst forecasts only using an unbiased methodology and our articles are not intended to be financial advice. It does not constitute a recommendation to buy or sell any stock, and does not take account of your objectives, or your financial situation. We aim to bring you long-term focused analysis driven by fundamental data. Note that our analysis may not factor in the latest price-sensitive company announcements or qualitative material. Simply Wall St has no position in any stocks mentioned.
