
 Yahoo Finance
 The Returns On Capital At Oxford Metrics (LON:OMG) Don't Inspire Confidence
To avoid investing in a business that's in decline, there's a few financial metrics that can provide early indications of aging. A business that's potentially in decline often shows two trends, a return on capital employed (ROCE) that's declining, and a base of capital employed that's also declining. This combination can tell you that not only is the company investing less, it's earning less on what it does invest. On that note, looking into Oxford Metrics (LON:OMG), we weren't too upbeat about how things were going.
Understanding Return On Capital Employed (ROCE)
For those that aren't sure what ROCE is, it measures the amount of pre-tax profits a company can generate from the capital employed in its business. To calculate this metric for Oxford Metrics, this is the formula:
Return on Capital Employed = Earnings Before Interest and Tax (EBIT) ÷ (Total Assets - Current Liabilities)
0.11 = UK£3.7m ÷ (UK£51m - UK£16m) (Based on the trailing twelve months to March 2022).
Thus, Oxford Metrics has an ROCE of 11%. On its own, that's a standard return, however it's much better than the 7.9% generated by the Software industry.
Check out our latest analysis for Oxford Metrics
Above you can see how the current ROCE for Oxford Metrics compares to its prior returns on capital, but there's only so much you can tell from the past. If you'd like, you can check out the forecasts from the analysts covering Oxford Metrics here for free.
The Trend Of ROCE
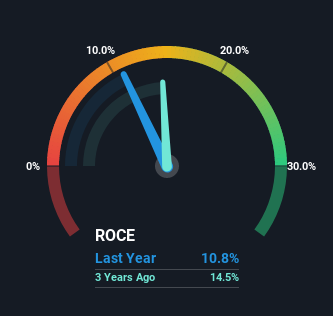
In terms of Oxford Metrics' historical ROCE movements, the trend doesn't inspire confidence. To be more specific, the ROCE was 17% five years ago, but since then it has dropped noticeably. And on the capital employed front, the business is utilizing roughly the same amount of capital as it was back then. Since returns are falling and the business has the same amount of assets employed, this can suggest it's a mature business that hasn't had much growth in the last five years. If these trends continue, we wouldn't expect Oxford Metrics to turn into a multi-bagger.
The Bottom Line On Oxford Metrics' ROCE
In the end, the trend of lower returns on the same amount of capital isn't typically an indication that we're looking at a growth stock. Yet despite these concerning fundamentals, the stock has performed strongly with a 58% return over the last five years, so investors appear very optimistic. Regardless, we don't feel too comfortable with the fundamentals so we'd be steering clear of this stock for now.
One more thing: We've identified 5 warning signs with Oxford Metrics (at least 1 which is significant) , and understanding these would certainly be useful.
While Oxford Metrics isn't earning the highest return, check out this free list of companies that are earning high returns on equity with solid balance sheets.
Have feedback on this article? Concerned about the content? Get in touch with us directly. Alternatively, email editorial-team (at) simplywallst.com.
This article by Simply Wall St is general in nature. We provide commentary based on historical data and analyst forecasts only using an unbiased methodology and our articles are not intended to be financial advice. It does not constitute a recommendation to buy or sell any stock, and does not take account of your objectives, or your financial situation. We aim to bring you long-term focused analysis driven by fundamental data. Note that our analysis may not factor in the latest price-sensitive company announcements or qualitative material. Simply Wall St has no position in any stocks mentioned.
Join A Paid User Research Session
You’ll receive a US$30 Amazon Gift card for 1 hour of your time while helping us build better investing tools for the individual investors like yourself. Sign up here
