
 Yahoo Finance
 Returns on Capital Paint A Bright Future For Gemfields Group (JSE:GML)
If we want to find a stock that could multiply over the long term, what are the underlying trends we should look for? Ideally, a business will show two trends; firstly a growing return on capital employed (ROCE) and secondly, an increasing amount of capital employed. Put simply, these types of businesses are compounding machines, meaning they are continually reinvesting their earnings at ever-higher rates of return. With that in mind, the ROCE of Gemfields Group (JSE:GML) looks great, so lets see what the trend can tell us.
What Is Return On Capital Employed (ROCE)?
If you haven't worked with ROCE before, it measures the 'return' (pre-tax profit) a company generates from capital employed in its business. Analysts use this formula to calculate it for Gemfields Group:
Return on Capital Employed = Earnings Before Interest and Tax (EBIT) ÷ (Total Assets - Current Liabilities)
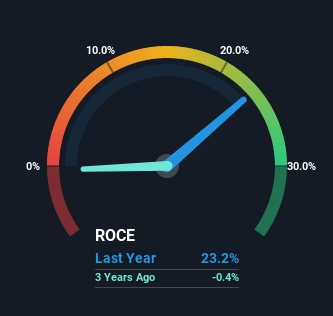
0.23 = US$160m ÷ (US$780m - US$90m) (Based on the trailing twelve months to June 2022).
Therefore, Gemfields Group has an ROCE of 23%. In absolute terms that's a very respectable return and compared to the Metals and Mining industry average of 25% it's pretty much on par.
Check out our latest analysis for Gemfields Group
Above you can see how the current ROCE for Gemfields Group compares to its prior returns on capital, but there's only so much you can tell from the past. If you'd like to see what analysts are forecasting going forward, you should check out our free report for Gemfields Group.
The Trend Of ROCE
Investors would be pleased with what's happening at Gemfields Group. Over the last five years, returns on capital employed have risen substantially to 23%. Basically the business is earning more per dollar of capital invested and in addition to that, 90% more capital is being employed now too. This can indicate that there's plenty of opportunities to invest capital internally and at ever higher rates, a combination that's common among multi-baggers.
For the record though, there was a noticeable increase in the company's current liabilities over the period, so we would attribute some of the ROCE growth to that. The current liabilities has increased to 12% of total assets, so the business is now more funded by the likes of its suppliers or short-term creditors. It's worth keeping an eye on this because as the percentage of current liabilities to total assets increases, some aspects of risk also increase.
What We Can Learn From Gemfields Group's ROCE
All in all, it's terrific to see that Gemfields Group is reaping the rewards from prior investments and is growing its capital base. And with a respectable 51% awarded to those who held the stock over the last five years, you could argue that these developments are starting to get the attention they deserve. So given the stock has proven it has promising trends, it's worth researching the company further to see if these trends are likely to persist.
If you want to continue researching Gemfields Group, you might be interested to know about the 3 warning signs that our analysis has discovered.
If you want to search for more stocks that have been earning high returns, check out this free list of stocks with solid balance sheets that are also earning high returns on equity.
Have feedback on this article? Concerned about the content? Get in touch with us directly. Alternatively, email editorial-team (at) simplywallst.com.
This article by Simply Wall St is general in nature. We provide commentary based on historical data and analyst forecasts only using an unbiased methodology and our articles are not intended to be financial advice. It does not constitute a recommendation to buy or sell any stock, and does not take account of your objectives, or your financial situation. We aim to bring you long-term focused analysis driven by fundamental data. Note that our analysis may not factor in the latest price-sensitive company announcements or qualitative material. Simply Wall St has no position in any stocks mentioned.
Join A Paid User Research Session
You’ll receive a US$30 Amazon Gift card for 1 hour of your time while helping us build better investing tools for the individual investors like yourself. Sign up here
