
 Yahoo Finance
 Returns on Capital Paint A Bright Future For Billington Holdings (LON:BILN)
What trends should we look for it we want to identify stocks that can multiply in value over the long term? In a perfect world, we'd like to see a company investing more capital into its business and ideally the returns earned from that capital are also increasing. This shows us that it's a compounding machine, able to continually reinvest its earnings back into the business and generate higher returns. Speaking of which, we noticed some great changes in Billington Holdings' (LON:BILN) returns on capital, so let's have a look.
What Is Return On Capital Employed (ROCE)?
If you haven't worked with ROCE before, it measures the 'return' (pre-tax profit) a company generates from capital employed in its business. To calculate this metric for Billington Holdings, this is the formula:
Return on Capital Employed = Earnings Before Interest and Tax (EBIT) ÷ (Total Assets - Current Liabilities)
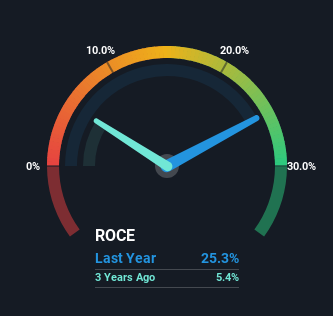
0.25 = UK£13m ÷ (UK£82m - UK£29m) (Based on the trailing twelve months to December 2023).
Thus, Billington Holdings has an ROCE of 25%. That's a fantastic return and not only that, it outpaces the average of 12% earned by companies in a similar industry.
See our latest analysis for Billington Holdings
Above you can see how the current ROCE for Billington Holdings compares to its prior returns on capital, but there's only so much you can tell from the past. If you're interested, you can view the analysts predictions in our free analyst report for Billington Holdings .
The Trend Of ROCE
Billington Holdings is displaying some positive trends. Over the last five years, returns on capital employed have risen substantially to 25%. Basically the business is earning more per dollar of capital invested and in addition to that, 110% more capital is being employed now too. So we're very much inspired by what we're seeing at Billington Holdings thanks to its ability to profitably reinvest capital.
In Conclusion...
A company that is growing its returns on capital and can consistently reinvest in itself is a highly sought after trait, and that's what Billington Holdings has. Since the stock has returned a solid 79% to shareholders over the last five years, it's fair to say investors are beginning to recognize these changes. With that being said, we still think the promising fundamentals mean the company deserves some further due diligence.
One more thing: We've identified 3 warning signs with Billington Holdings (at least 1 which is potentially serious) , and understanding them would certainly be useful.
If you want to search for more stocks that have been earning high returns, check out this free list of stocks with solid balance sheets that are also earning high returns on equity.
Have feedback on this article? Concerned about the content? Get in touch with us directly. Alternatively, email editorial-team (at) simplywallst.com.
This article by Simply Wall St is general in nature. We provide commentary based on historical data and analyst forecasts only using an unbiased methodology and our articles are not intended to be financial advice. It does not constitute a recommendation to buy or sell any stock, and does not take account of your objectives, or your financial situation. We aim to bring you long-term focused analysis driven by fundamental data. Note that our analysis may not factor in the latest price-sensitive company announcements or qualitative material. Simply Wall St has no position in any stocks mentioned.
