
 Yahoo Finance
 The Returns On Capital At QinetiQ Group (LON:QQ.) Don't Inspire Confidence
If we want to find a stock that could multiply over the long term, what are the underlying trends we should look for? In a perfect world, we'd like to see a company investing more capital into its business and ideally the returns earned from that capital are also increasing. Basically this means that a company has profitable initiatives that it can continue to reinvest in, which is a trait of a compounding machine. However, after investigating QinetiQ Group (LON:QQ.), we don't think it's current trends fit the mold of a multi-bagger.
Return On Capital Employed (ROCE): What is it?
For those that aren't sure what ROCE is, it measures the amount of pre-tax profits a company can generate from the capital employed in its business. The formula for this calculation on QinetiQ Group is:
Return on Capital Employed = Earnings Before Interest and Tax (EBIT) ÷ (Total Assets - Current Liabilities)
0.13 = UK£140m ÷ (UK£1.5b - UK£427m) (Based on the trailing twelve months to March 2021).
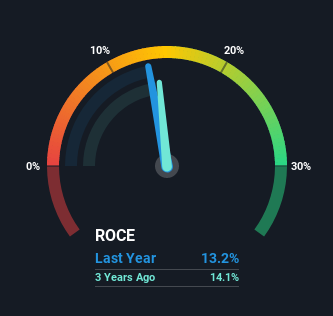
Therefore, QinetiQ Group has an ROCE of 13%. On its own, that's a standard return, however it's much better than the 9.3% generated by the Aerospace & Defense industry.
See our latest analysis for QinetiQ Group
Above you can see how the current ROCE for QinetiQ Group compares to its prior returns on capital, but there's only so much you can tell from the past. If you'd like, you can check out the forecasts from the analysts covering QinetiQ Group here for free.
The Trend Of ROCE
When we looked at the ROCE trend at QinetiQ Group, we didn't gain much confidence. To be more specific, ROCE has fallen from 28% over the last five years. However, given capital employed and revenue have both increased it appears that the business is currently pursuing growth, at the consequence of short term returns. If these investments prove successful, this can bode very well for long term stock performance.
On a side note, QinetiQ Group has done well to pay down its current liabilities to 29% of total assets. So we could link some of this to the decrease in ROCE. What's more, this can reduce some aspects of risk to the business because now the company's suppliers or short-term creditors are funding less of its operations. Since the business is basically funding more of its operations with it's own money, you could argue this has made the business less efficient at generating ROCE.
The Bottom Line
In summary, despite lower returns in the short term, we're encouraged to see that QinetiQ Group is reinvesting for growth and has higher sales as a result. Furthermore the stock has climbed 64% over the last five years, it would appear that investors are upbeat about the future. So should these growth trends continue, we'd be optimistic on the stock going forward.
On a separate note, we've found 1 warning sign for QinetiQ Group you'll probably want to know about.
If you want to search for solid companies with great earnings, check out this free list of companies with good balance sheets and impressive returns on equity.
This article by Simply Wall St is general in nature. We provide commentary based on historical data and analyst forecasts only using an unbiased methodology and our articles are not intended to be financial advice. It does not constitute a recommendation to buy or sell any stock, and does not take account of your objectives, or your financial situation. We aim to bring you long-term focused analysis driven by fundamental data. Note that our analysis may not factor in the latest price-sensitive company announcements or qualitative material. Simply Wall St has no position in any stocks mentioned.
Have feedback on this article? Concerned about the content? Get in touch with us directly. Alternatively, email editorial-team (at) simplywallst.com.
