
 Yahoo Finance
 Returns On Capital At Rollins (NYSE:ROL) Paint A Concerning Picture
If you're not sure where to start when looking for the next multi-bagger, there are a few key trends you should keep an eye out for. Typically, we'll want to notice a trend of growing return on capital employed (ROCE) and alongside that, an expanding base of capital employed. This shows us that it's a compounding machine, able to continually reinvest its earnings back into the business and generate higher returns. Looking at Rollins (NYSE:ROL), it does have a high ROCE right now, but lets see how returns are trending.
What Is Return On Capital Employed (ROCE)?
Just to clarify if you're unsure, ROCE is a metric for evaluating how much pre-tax income (in percentage terms) a company earns on the capital invested in its business. The formula for this calculation on Rollins is:
Return on Capital Employed = Earnings Before Interest and Tax (EBIT) ÷ (Total Assets - Current Liabilities)
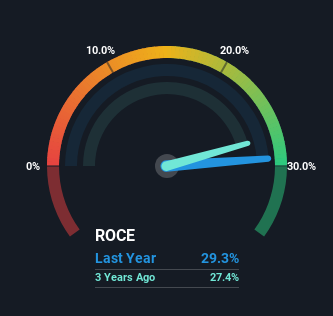
0.29 = US$592m ÷ (US$2.6b - US$577m) (Based on the trailing twelve months to December 2023).
Therefore, Rollins has an ROCE of 29%. In absolute terms that's a great return and it's even better than the Commercial Services industry average of 10%.
View our latest analysis for Rollins
In the above chart we have measured Rollins' prior ROCE against its prior performance, but the future is arguably more important. If you'd like, you can check out the forecasts from the analysts covering Rollins for free.
What Does the ROCE Trend For Rollins Tell Us?
In terms of Rollins' historical ROCE movements, the trend isn't fantastic. To be more specific, while the ROCE is still high, it's fallen from 39% where it was five years ago. However, given capital employed and revenue have both increased it appears that the business is currently pursuing growth, at the consequence of short term returns. If these investments prove successful, this can bode very well for long term stock performance.
The Bottom Line On Rollins' ROCE
Even though returns on capital have fallen in the short term, we find it promising that revenue and capital employed have both increased for Rollins. And the stock has followed suit returning a meaningful 73% to shareholders over the last five years. So while the underlying trends could already be accounted for by investors, we still think this stock is worth looking into further.
If you're still interested in Rollins it's worth checking out our FREE intrinsic value approximation for ROL to see if it's trading at an attractive price in other respects.
If you'd like to see other companies earning high returns, check out our free list of companies earning high returns with solid balance sheets here.
Have feedback on this article? Concerned about the content? Get in touch with us directly. Alternatively, email editorial-team (at) simplywallst.com.
This article by Simply Wall St is general in nature. We provide commentary based on historical data and analyst forecasts only using an unbiased methodology and our articles are not intended to be financial advice. It does not constitute a recommendation to buy or sell any stock, and does not take account of your objectives, or your financial situation. We aim to bring you long-term focused analysis driven by fundamental data. Note that our analysis may not factor in the latest price-sensitive company announcements or qualitative material. Simply Wall St has no position in any stocks mentioned.
