
 Yahoo Finance
 Returns On Capital At Royal Caribbean Cruises (NYSE:RCL) Paint A Concerning Picture
If you're not sure where to start when looking for the next multi-bagger, there are a few key trends you should keep an eye out for. One common approach is to try and find a company with returns on capital employed (ROCE) that are increasing, in conjunction with a growing amount of capital employed. Ultimately, this demonstrates that it's a business that is reinvesting profits at increasing rates of return. However, after briefly looking over the numbers, we don't think Royal Caribbean Cruises (NYSE:RCL) has the makings of a multi-bagger going forward, but let's have a look at why that may be.
Understanding Return On Capital Employed (ROCE)
If you haven't worked with ROCE before, it measures the 'return' (pre-tax profit) a company generates from capital employed in its business. Analysts use this formula to calculate it for Royal Caribbean Cruises:
Return on Capital Employed = Earnings Before Interest and Tax (EBIT) ÷ (Total Assets - Current Liabilities)
0.016 = US$379m ÷ (US$33b - US$9.4b) (Based on the trailing twelve months to March 2023).
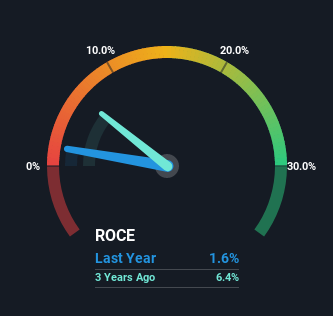
Therefore, Royal Caribbean Cruises has an ROCE of 1.6%. Ultimately, that's a low return and it under-performs the Hospitality industry average of 9.8%.
See our latest analysis for Royal Caribbean Cruises
In the above chart we have measured Royal Caribbean Cruises' prior ROCE against its prior performance, but the future is arguably more important. If you'd like to see what analysts are forecasting going forward, you should check out our free report for Royal Caribbean Cruises.
So How Is Royal Caribbean Cruises' ROCE Trending?
When we looked at the ROCE trend at Royal Caribbean Cruises, we didn't gain much confidence. Around five years ago the returns on capital were 9.3%, but since then they've fallen to 1.6%. Although, given both revenue and the amount of assets employed in the business have increased, it could suggest the company is investing in growth, and the extra capital has led to a short-term reduction in ROCE. If these investments prove successful, this can bode very well for long term stock performance.
The Bottom Line On Royal Caribbean Cruises' ROCE
In summary, despite lower returns in the short term, we're encouraged to see that Royal Caribbean Cruises is reinvesting for growth and has higher sales as a result. However, despite the promising trends, the stock has fallen 29% over the last five years, so there might be an opportunity here for astute investors. As a result, we'd recommend researching this stock further to uncover what other fundamentals of the business can show us.
Royal Caribbean Cruises does have some risks though, and we've spotted 1 warning sign for Royal Caribbean Cruises that you might be interested in.
While Royal Caribbean Cruises isn't earning the highest return, check out this free list of companies that are earning high returns on equity with solid balance sheets.
Have feedback on this article? Concerned about the content? Get in touch with us directly. Alternatively, email editorial-team (at) simplywallst.com.
This article by Simply Wall St is general in nature. We provide commentary based on historical data and analyst forecasts only using an unbiased methodology and our articles are not intended to be financial advice. It does not constitute a recommendation to buy or sell any stock, and does not take account of your objectives, or your financial situation. We aim to bring you long-term focused analysis driven by fundamental data. Note that our analysis may not factor in the latest price-sensitive company announcements or qualitative material. Simply Wall St has no position in any stocks mentioned.
Join A Paid User Research Session
You’ll receive a US$30 Amazon Gift card for 1 hour of your time while helping us build better investing tools for the individual investors like yourself. Sign up here
