
 Yahoo Finance
 Returns On Capital Are Showing Encouraging Signs At Brightcove (NASDAQ:BCOV)
There are a few key trends to look for if we want to identify the next multi-bagger. In a perfect world, we'd like to see a company investing more capital into its business and ideally the returns earned from that capital are also increasing. Basically this means that a company has profitable initiatives that it can continue to reinvest in, which is a trait of a compounding machine. So on that note, Brightcove (NASDAQ:BCOV) looks quite promising in regards to its trends of return on capital.
Understanding Return On Capital Employed (ROCE)
For those who don't know, ROCE is a measure of a company's yearly pre-tax profit (its return), relative to the capital employed in the business. Analysts use this formula to calculate it for Brightcove:
Return on Capital Employed = Earnings Before Interest and Tax (EBIT) ÷ (Total Assets - Current Liabilities)
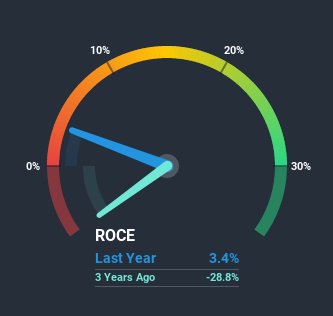
0.034 = US$3.0m ÷ (US$187m - US$99m) (Based on the trailing twelve months to December 2020).
So, Brightcove has an ROCE of 3.4%. Ultimately, that's a low return and it under-performs the IT industry average of 11%.
See our latest analysis for Brightcove
Above you can see how the current ROCE for Brightcove compares to its prior returns on capital, but there's only so much you can tell from the past. If you're interested, you can view the analysts predictions in our free report on analyst forecasts for the company.
The Trend Of ROCE
Brightcove has broken into the black (profitability) and we're sure it's a sight for sore eyes. The company was generating losses five years ago, but has managed to turn it around and as we saw earlier is now earning 3.4%, which is always encouraging. Interestingly, the capital employed by the business has remained relatively flat, so these higher returns are either from prior investments paying off or increased efficiencies. With no noticeable increase in capital employed, it's worth knowing what the company plans on doing going forward in regards to reinvesting and growing the business. Because in the end, a business can only get so efficient.
For the record though, there was a noticeable increase in the company's current liabilities over the period, so we would attribute some of the ROCE growth to that. The current liabilities has increased to 53% of total assets, so the business is now more funded by the likes of its suppliers or short-term creditors. And with current liabilities at those levels, that's pretty high.
Our Take On Brightcove's ROCE
To sum it up, Brightcove is collecting higher returns from the same amount of capital, and that's impressive. And a remarkable 256% total return over the last five years tells us that investors are expecting more good things to come in the future. So given the stock has proven it has promising trends, it's worth researching the company further to see if these trends are likely to persist.
On a separate note, we've found 1 warning sign for Brightcove you'll probably want to know about.
While Brightcove isn't earning the highest return, check out this free list of companies that are earning high returns on equity with solid balance sheets.
This article by Simply Wall St is general in nature. It does not constitute a recommendation to buy or sell any stock, and does not take account of your objectives, or your financial situation. We aim to bring you long-term focused analysis driven by fundamental data. Note that our analysis may not factor in the latest price-sensitive company announcements or qualitative material. Simply Wall St has no position in any stocks mentioned.
Have feedback on this article? Concerned about the content? Get in touch with us directly. Alternatively, email editorial-team (at) simplywallst.com.
