
 Yahoo Finance
 Returns On Capital Are Showing Encouraging Signs At Full House Resorts (NASDAQ:FLL)
If we want to find a stock that could multiply over the long term, what are the underlying trends we should look for? In a perfect world, we'd like to see a company investing more capital into its business and ideally the returns earned from that capital are also increasing. Ultimately, this demonstrates that it's a business that is reinvesting profits at increasing rates of return. Speaking of which, we noticed some great changes in Full House Resorts' (NASDAQ:FLL) returns on capital, so let's have a look.
Understanding Return On Capital Employed (ROCE)
For those that aren't sure what ROCE is, it measures the amount of pre-tax profits a company can generate from the capital employed in its business. To calculate this metric for Full House Resorts, this is the formula:
Return on Capital Employed = Earnings Before Interest and Tax (EBIT) ÷ (Total Assets - Current Liabilities)
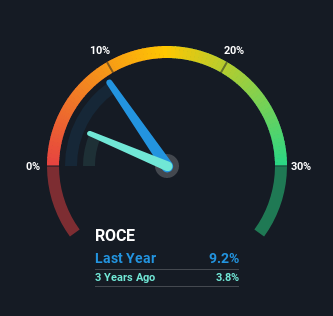
0.092 = US$40m ÷ (US$468m - US$36m) (Based on the trailing twelve months to June 2021).
So, Full House Resorts has an ROCE of 9.2%. In absolute terms, that's a low return, but it's much better than the Hospitality industry average of 7.4%.
See our latest analysis for Full House Resorts
In the above chart we have measured Full House Resorts' prior ROCE against its prior performance, but the future is arguably more important. If you're interested, you can view the analysts predictions in our free report on analyst forecasts for the company.
What Does the ROCE Trend For Full House Resorts Tell Us?
We're glad to see that ROCE is heading in the right direction, even if it is still low at the moment. The data shows that returns on capital have increased substantially over the last five years to 9.2%. The company is effectively making more money per dollar of capital used, and it's worth noting that the amount of capital has increased too, by 177%. This can indicate that there's plenty of opportunities to invest capital internally and at ever higher rates, a combination that's common among multi-baggers.
The Bottom Line On Full House Resorts' ROCE
To sum it up, Full House Resorts has proven it can reinvest in the business and generate higher returns on that capital employed, which is terrific. And with the stock having performed exceptionally well over the last five years, these patterns are being accounted for by investors. In light of that, we think it's worth looking further into this stock because if Full House Resorts can keep these trends up, it could have a bright future ahead.
If you'd like to know more about Full House Resorts, we've spotted 3 warning signs, and 1 of them is potentially serious.
While Full House Resorts may not currently earn the highest returns, we've compiled a list of companies that currently earn more than 25% return on equity. Check out this free list here.
This article by Simply Wall St is general in nature. We provide commentary based on historical data and analyst forecasts only using an unbiased methodology and our articles are not intended to be financial advice. It does not constitute a recommendation to buy or sell any stock, and does not take account of your objectives, or your financial situation. We aim to bring you long-term focused analysis driven by fundamental data. Note that our analysis may not factor in the latest price-sensitive company announcements or qualitative material. Simply Wall St has no position in any stocks mentioned.
Have feedback on this article? Concerned about the content? Get in touch with us directly. Alternatively, email editorial-team (at) simplywallst.com.
