
 Yahoo Finance
 Returns On Capital Are Showing Encouraging Signs At Nordwest Handel (FRA:NWX)
What trends should we look for it we want to identify stocks that can multiply in value over the long term? In a perfect world, we'd like to see a company investing more capital into its business and ideally the returns earned from that capital are also increasing. Put simply, these types of businesses are compounding machines, meaning they are continually reinvesting their earnings at ever-higher rates of return. With that in mind, we've noticed some promising trends at Nordwest Handel (FRA:NWX) so let's look a bit deeper.
What Is Return On Capital Employed (ROCE)?
Just to clarify if you're unsure, ROCE is a metric for evaluating how much pre-tax income (in percentage terms) a company earns on the capital invested in its business. Analysts use this formula to calculate it for Nordwest Handel:
Return on Capital Employed = Earnings Before Interest and Tax (EBIT) ÷ (Total Assets - Current Liabilities)
0.17 = €21m ÷ (€477m - €356m) (Based on the trailing twelve months to September 2023).
So, Nordwest Handel has an ROCE of 17%. In absolute terms, that's a satisfactory return, but compared to the Trade Distributors industry average of 13% it's much better.
See our latest analysis for Nordwest Handel
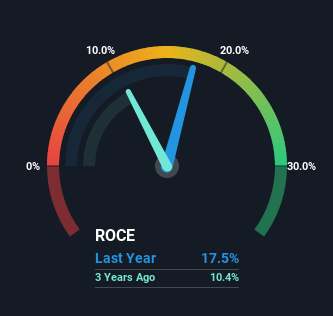
Historical performance is a great place to start when researching a stock so above you can see the gauge for Nordwest Handel's ROCE against it's prior returns. If you're interested in investigating Nordwest Handel's past further, check out this free graph covering Nordwest Handel's past earnings, revenue and cash flow.
So How Is Nordwest Handel's ROCE Trending?
Nordwest Handel is displaying some positive trends. Over the last five years, returns on capital employed have risen substantially to 17%. The amount of capital employed has increased too, by 32%. The increasing returns on a growing amount of capital is common amongst multi-baggers and that's why we're impressed.
On a separate but related note, it's important to know that Nordwest Handel has a current liabilities to total assets ratio of 75%, which we'd consider pretty high. This can bring about some risks because the company is basically operating with a rather large reliance on its suppliers or other sorts of short-term creditors. Ideally we'd like to see this reduce as that would mean fewer obligations bearing risks.
The Bottom Line On Nordwest Handel's ROCE
All in all, it's terrific to see that Nordwest Handel is reaping the rewards from prior investments and is growing its capital base. Considering the stock has delivered 8.3% to its stockholders over the last five years, it may be fair to think that investors aren't fully aware of the promising trends yet. So with that in mind, we think the stock deserves further research.
Nordwest Handel does have some risks though, and we've spotted 2 warning signs for Nordwest Handel that you might be interested in.
While Nordwest Handel may not currently earn the highest returns, we've compiled a list of companies that currently earn more than 25% return on equity. Check out this free list here.
Have feedback on this article? Concerned about the content? Get in touch with us directly. Alternatively, email editorial-team (at) simplywallst.com.
This article by Simply Wall St is general in nature. We provide commentary based on historical data and analyst forecasts only using an unbiased methodology and our articles are not intended to be financial advice. It does not constitute a recommendation to buy or sell any stock, and does not take account of your objectives, or your financial situation. We aim to bring you long-term focused analysis driven by fundamental data. Note that our analysis may not factor in the latest price-sensitive company announcements or qualitative material. Simply Wall St has no position in any stocks mentioned.
