
 Yahoo Finance
 Returns On Capital Are Showing Encouraging Signs At Kraken Robotics (CVE:PNG)
Finding a business that has the potential to grow substantially is not easy, but it is possible if we look at a few key financial metrics. In a perfect world, we'd like to see a company investing more capital into its business and ideally the returns earned from that capital are also increasing. If you see this, it typically means it's a company with a great business model and plenty of profitable reinvestment opportunities. With that in mind, we've noticed some promising trends at Kraken Robotics (CVE:PNG) so let's look a bit deeper.
Understanding Return On Capital Employed (ROCE)
For those who don't know, ROCE is a measure of a company's yearly pre-tax profit (its return), relative to the capital employed in the business. Analysts use this formula to calculate it for Kraken Robotics:
Return on Capital Employed = Earnings Before Interest and Tax (EBIT) ÷ (Total Assets - Current Liabilities)
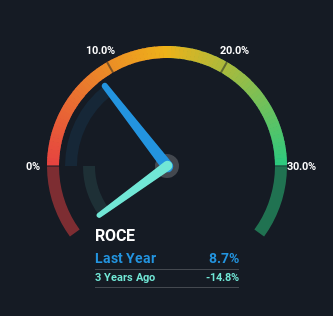
0.087 = CA$2.9m ÷ (CA$71m - CA$38m) (Based on the trailing twelve months to September 2023).
Thus, Kraken Robotics has an ROCE of 8.7%. Ultimately, that's a low return and it under-performs the Electronic industry average of 15%.
View our latest analysis for Kraken Robotics
Above you can see how the current ROCE for Kraken Robotics compares to its prior returns on capital, but there's only so much you can tell from the past. If you'd like to see what analysts are forecasting going forward, you should check out our free report for Kraken Robotics.
What The Trend Of ROCE Can Tell Us
We're delighted to see that Kraken Robotics is reaping rewards from its investments and is now generating some pre-tax profits. About five years ago the company was generating losses but things have turned around because it's now earning 8.7% on its capital. Not only that, but the company is utilizing 812% more capital than before, but that's to be expected from a company trying to break into profitability. We like this trend, because it tells us the company has profitable reinvestment opportunities available to it, and if it continues going forward that can lead to a multi-bagger performance.
On a side note, Kraken Robotics' current liabilities are still rather high at 53% of total assets. This effectively means that suppliers (or short-term creditors) are funding a large portion of the business, so just be aware that this can introduce some elements of risk. Ideally we'd like to see this reduce as that would mean fewer obligations bearing risks.
The Key Takeaway
In summary, it's great to see that Kraken Robotics has managed to break into profitability and is continuing to reinvest in its business. Investors may not be impressed by the favorable underlying trends yet because over the last five years the stock has only returned 36% to shareholders. So exploring more about this stock could uncover a good opportunity, if the valuation and other metrics stack up.
Like most companies, Kraken Robotics does come with some risks, and we've found 1 warning sign that you should be aware of.
If you want to search for solid companies with great earnings, check out this free list of companies with good balance sheets and impressive returns on equity.
Have feedback on this article? Concerned about the content? Get in touch with us directly. Alternatively, email editorial-team (at) simplywallst.com.
This article by Simply Wall St is general in nature. We provide commentary based on historical data and analyst forecasts only using an unbiased methodology and our articles are not intended to be financial advice. It does not constitute a recommendation to buy or sell any stock, and does not take account of your objectives, or your financial situation. We aim to bring you long-term focused analysis driven by fundamental data. Note that our analysis may not factor in the latest price-sensitive company announcements or qualitative material. Simply Wall St has no position in any stocks mentioned.
