
 Yahoo Finance
 Returns On Capital Are Showing Encouraging Signs At NRW Holdings (ASX:NWH)
To find a multi-bagger stock, what are the underlying trends we should look for in a business? In a perfect world, we'd like to see a company investing more capital into its business and ideally the returns earned from that capital are also increasing. If you see this, it typically means it's a company with a great business model and plenty of profitable reinvestment opportunities. So on that note, NRW Holdings (ASX:NWH) looks quite promising in regards to its trends of return on capital.
Understanding Return On Capital Employed (ROCE)
For those that aren't sure what ROCE is, it measures the amount of pre-tax profits a company can generate from the capital employed in its business. To calculate this metric for NRW Holdings, this is the formula:
Return on Capital Employed = Earnings Before Interest and Tax (EBIT) ÷ (Total Assets - Current Liabilities)
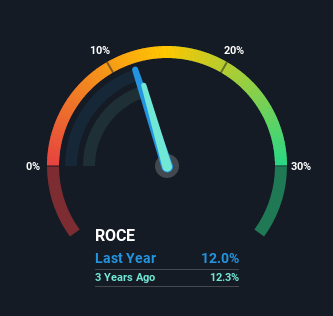
0.12 = AU$95m ÷ (AU$1.3b - AU$509m) (Based on the trailing twelve months to June 2021).
Thus, NRW Holdings has an ROCE of 12%. That's a pretty standard return and it's in line with the industry average of 12%.
See our latest analysis for NRW Holdings
In the above chart we have measured NRW Holdings' prior ROCE against its prior performance, but the future is arguably more important. If you'd like, you can check out the forecasts from the analysts covering NRW Holdings here for free.
What Can We Tell From NRW Holdings' ROCE Trend?
NRW Holdings is displaying some positive trends. The numbers show that in the last five years, the returns generated on capital employed have grown considerably to 12%. Basically the business is earning more per dollar of capital invested and in addition to that, 276% more capital is being employed now too. So we're very much inspired by what we're seeing at NRW Holdings thanks to its ability to profitably reinvest capital.
The Bottom Line On NRW Holdings' ROCE
To sum it up, NRW Holdings has proven it can reinvest in the business and generate higher returns on that capital employed, which is terrific. And a remarkable 190% total return over the last five years tells us that investors are expecting more good things to come in the future. With that being said, we still think the promising fundamentals mean the company deserves some further due diligence.
If you'd like to know about the risks facing NRW Holdings, we've discovered 3 warning signs that you should be aware of.
While NRW Holdings may not currently earn the highest returns, we've compiled a list of companies that currently earn more than 25% return on equity. Check out this free list here.
Have feedback on this article? Concerned about the content? Get in touch with us directly. Alternatively, email editorial-team (at) simplywallst.com.
This article by Simply Wall St is general in nature. We provide commentary based on historical data and analyst forecasts only using an unbiased methodology and our articles are not intended to be financial advice. It does not constitute a recommendation to buy or sell any stock, and does not take account of your objectives, or your financial situation. We aim to bring you long-term focused analysis driven by fundamental data. Note that our analysis may not factor in the latest price-sensitive company announcements or qualitative material. Simply Wall St has no position in any stocks mentioned.
