
 Yahoo Finance
 Returns On Capital Signal Difficult Times Ahead For InnoTec TSS (FRA:TSS)
What financial metrics can indicate to us that a company is maturing or even in decline? A business that's potentially in decline often shows two trends, a return on capital employed (ROCE) that's declining, and a base of capital employed that's also declining. Ultimately this means that the company is earning less per dollar invested and on top of that, it's shrinking its base of capital employed. In light of that, from a first glance at InnoTec TSS (FRA:TSS), we've spotted some signs that it could be struggling, so let's investigate.
Return On Capital Employed (ROCE): What Is It?
For those who don't know, ROCE is a measure of a company's yearly pre-tax profit (its return), relative to the capital employed in the business. To calculate this metric for InnoTec TSS, this is the formula:
Return on Capital Employed = Earnings Before Interest and Tax (EBIT) ÷ (Total Assets - Current Liabilities)
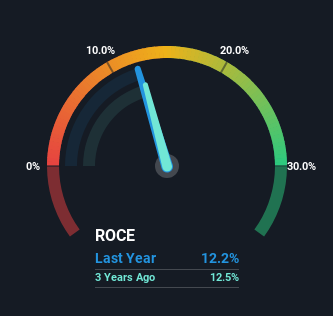
0.12 = €12m ÷ (€113m - €15m) (Based on the trailing twelve months to June 2023).
Therefore, InnoTec TSS has an ROCE of 12%. That's a relatively normal return on capital, and it's around the 13% generated by the Building industry.
View our latest analysis for InnoTec TSS
While the past is not representative of the future, it can be helpful to know how a company has performed historically, which is why we have this chart above. If you want to delve into the historical earnings , check out these free graphs detailing revenue and cash flow performance of InnoTec TSS.
What Can We Tell From InnoTec TSS' ROCE Trend?
There is reason to be cautious about InnoTec TSS, given the returns are trending downwards. About five years ago, returns on capital were 16%, however they're now substantially lower than that as we saw above. Meanwhile, capital employed in the business has stayed roughly the flat over the period. Since returns are falling and the business has the same amount of assets employed, this can suggest it's a mature business that hasn't had much growth in the last five years. So because these trends aren't typically conducive to creating a multi-bagger, we wouldn't hold our breath on InnoTec TSS becoming one if things continue as they have.
In Conclusion...
In summary, it's unfortunate that InnoTec TSS is generating lower returns from the same amount of capital. It should come as no surprise then that the stock has fallen 23% over the last five years, so it looks like investors are recognizing these changes. That being the case, unless the underlying trends revert to a more positive trajectory, we'd consider looking elsewhere.
Like most companies, InnoTec TSS does come with some risks, and we've found 1 warning sign that you should be aware of.
If you want to search for solid companies with great earnings, check out this free list of companies with good balance sheets and impressive returns on equity.
Have feedback on this article? Concerned about the content? Get in touch with us directly. Alternatively, email editorial-team (at) simplywallst.com.
This article by Simply Wall St is general in nature. We provide commentary based on historical data and analyst forecasts only using an unbiased methodology and our articles are not intended to be financial advice. It does not constitute a recommendation to buy or sell any stock, and does not take account of your objectives, or your financial situation. We aim to bring you long-term focused analysis driven by fundamental data. Note that our analysis may not factor in the latest price-sensitive company announcements or qualitative material. Simply Wall St has no position in any stocks mentioned.
