
 Yahoo Finance
 Returns On Capital Signal Tricky Times Ahead For EnSilica (LON:ENSI)
Finding a business that has the potential to grow substantially is not easy, but it is possible if we look at a few key financial metrics. In a perfect world, we'd like to see a company investing more capital into its business and ideally the returns earned from that capital are also increasing. Put simply, these types of businesses are compounding machines, meaning they are continually reinvesting their earnings at ever-higher rates of return. However, after investigating EnSilica (LON:ENSI), we don't think it's current trends fit the mold of a multi-bagger.
What Is Return On Capital Employed (ROCE)?
If you haven't worked with ROCE before, it measures the 'return' (pre-tax profit) a company generates from capital employed in its business. The formula for this calculation on EnSilica is:
Return on Capital Employed = Earnings Before Interest and Tax (EBIT) ÷ (Total Assets - Current Liabilities)
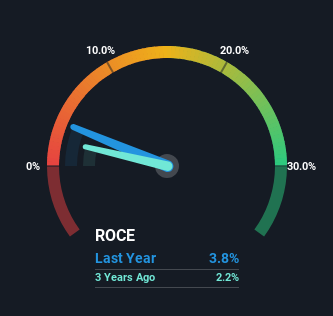
0.038 = UK£818k ÷ (UK£27m - UK£5.8m) (Based on the trailing twelve months to May 2023).
So, EnSilica has an ROCE of 3.8%. In absolute terms, that's a low return and it also under-performs the Semiconductor industry average of 16%.
View our latest analysis for EnSilica
In the above chart we have measured EnSilica's prior ROCE against its prior performance, but the future is arguably more important. If you'd like, you can check out the forecasts from the analysts covering EnSilica here for free.
How Are Returns Trending?
On the surface, the trend of ROCE at EnSilica doesn't inspire confidence. Over the last four years, returns on capital have decreased to 3.8% from 12% four years ago. However, given capital employed and revenue have both increased it appears that the business is currently pursuing growth, at the consequence of short term returns. If these investments prove successful, this can bode very well for long term stock performance.
What We Can Learn From EnSilica's ROCE
While returns have fallen for EnSilica in recent times, we're encouraged to see that sales are growing and that the business is reinvesting in its operations. Furthermore the stock has climbed 38% over the last year, it would appear that investors are upbeat about the future. So while the underlying trends could already be accounted for by investors, we still think this stock is worth looking into further.
EnSilica does come with some risks though, we found 3 warning signs in our investment analysis, and 1 of those is a bit unpleasant...
While EnSilica isn't earning the highest return, check out this free list of companies that are earning high returns on equity with solid balance sheets.
Have feedback on this article? Concerned about the content? Get in touch with us directly. Alternatively, email editorial-team (at) simplywallst.com.
This article by Simply Wall St is general in nature. We provide commentary based on historical data and analyst forecasts only using an unbiased methodology and our articles are not intended to be financial advice. It does not constitute a recommendation to buy or sell any stock, and does not take account of your objectives, or your financial situation. We aim to bring you long-term focused analysis driven by fundamental data. Note that our analysis may not factor in the latest price-sensitive company announcements or qualitative material. Simply Wall St has no position in any stocks mentioned.
