
 Yahoo Finance
 Returns On Capital Signal Tricky Times Ahead For Zalando (ETR:ZAL)
Did you know there are some financial metrics that can provide clues of a potential multi-bagger? One common approach is to try and find a company with returns on capital employed (ROCE) that are increasing, in conjunction with a growing amount of capital employed. Ultimately, this demonstrates that it's a business that is reinvesting profits at increasing rates of return. Although, when we looked at Zalando (ETR:ZAL), it didn't seem to tick all of these boxes.
What Is Return On Capital Employed (ROCE)?
If you haven't worked with ROCE before, it measures the 'return' (pre-tax profit) a company generates from capital employed in its business. The formula for this calculation on Zalando is:
Return on Capital Employed = Earnings Before Interest and Tax (EBIT) ÷ (Total Assets - Current Liabilities)
0.04 = €153m ÷ (€6.8b - €3.0b) (Based on the trailing twelve months to June 2022).
Therefore, Zalando has an ROCE of 4.0%. In absolute terms, that's a low return and it also under-performs the Online Retail industry average of 7.7%.
View our latest analysis for Zalando
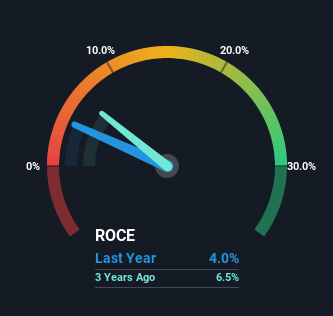
Above you can see how the current ROCE for Zalando compares to its prior returns on capital, but there's only so much you can tell from the past. If you're interested, you can view the analysts predictions in our free report on analyst forecasts for the company.
What Does the ROCE Trend For Zalando Tell Us?
In terms of Zalando's historical ROCE movements, the trend isn't fantastic. Over the last five years, returns on capital have decreased to 4.0% from 13% five years ago. On the other hand, the company has been employing more capital without a corresponding improvement in sales in the last year, which could suggest these investments are longer term plays. It's worth keeping an eye on the company's earnings from here on to see if these investments do end up contributing to the bottom line.
Another thing to note, Zalando has a high ratio of current liabilities to total assets of 44%. This can bring about some risks because the company is basically operating with a rather large reliance on its suppliers or other sorts of short-term creditors. While it's not necessarily a bad thing, it can be beneficial if this ratio is lower.
The Key Takeaway
In summary, Zalando is reinvesting funds back into the business for growth but unfortunately it looks like sales haven't increased much just yet. And investors appear hesitant that the trends will pick up because the stock has fallen 36% in the last five years. Therefore based on the analysis done in this article, we don't think Zalando has the makings of a multi-bagger.
One more thing: We've identified 3 warning signs with Zalando (at least 1 which can't be ignored) , and understanding these would certainly be useful.
While Zalando may not currently earn the highest returns, we've compiled a list of companies that currently earn more than 25% return on equity. Check out this free list here.
Have feedback on this article? Concerned about the content? Get in touch with us directly. Alternatively, email editorial-team (at) simplywallst.com.
This article by Simply Wall St is general in nature. We provide commentary based on historical data and analyst forecasts only using an unbiased methodology and our articles are not intended to be financial advice. It does not constitute a recommendation to buy or sell any stock, and does not take account of your objectives, or your financial situation. We aim to bring you long-term focused analysis driven by fundamental data. Note that our analysis may not factor in the latest price-sensitive company announcements or qualitative material. Simply Wall St has no position in any stocks mentioned.
Join A Paid User Research Session
You’ll receive a US$30 Amazon Gift card for 1 hour of your time while helping us build better investing tools for the individual investors like yourself. Sign up here
