
 Yahoo Finance
 Returns On Capital Signal Tricky Times Ahead For Anax Metals (ASX:ANX)
If we want to find a potential multi-bagger, often there are underlying trends that can provide clues. Ideally, a business will show two trends; firstly a growing return on capital employed (ROCE) and secondly, an increasing amount of capital employed. Basically this means that a company has profitable initiatives that it can continue to reinvest in, which is a trait of a compounding machine. Having said that, from a first glance at Anax Metals (ASX:ANX) we aren't jumping out of our chairs at how returns are trending, but let's have a deeper look.
Understanding Return On Capital Employed (ROCE)
For those who don't know, ROCE is a measure of a company's yearly pre-tax profit (its return), relative to the capital employed in the business. Analysts use this formula to calculate it for Anax Metals:
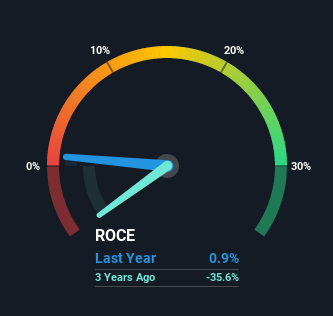
Return on Capital Employed = Earnings Before Interest and Tax (EBIT) ÷ (Total Assets - Current Liabilities)
0.0086 = AU$267k ÷ (AU$36m - AU$4.5m) (Based on the trailing twelve months to June 2021).
Thus, Anax Metals has an ROCE of 0.9%. Ultimately, that's a low return and it under-performs the Metals and Mining industry average of 8.8%.
Check out our latest analysis for Anax Metals
While the past is not representative of the future, it can be helpful to know how a company has performed historically, which is why we have this chart above. If you're interested in investigating Anax Metals' past further, check out this free graph of past earnings, revenue and cash flow.
So How Is Anax Metals' ROCE Trending?
In terms of Anax Metals' historical ROCE movements, the trend isn't fantastic. To be more specific, ROCE has fallen from 3.8% over the last five years. Although, given both revenue and the amount of assets employed in the business have increased, it could suggest the company is investing in growth, and the extra capital has led to a short-term reduction in ROCE. And if the increased capital generates additional returns, the business, and thus shareholders, will benefit in the long run.
While on the subject, we noticed that the ratio of current liabilities to total assets has risen to 13%, which has impacted the ROCE. If current liabilities hadn't increased as much as they did, the ROCE could actually be even lower. Keep an eye on this ratio, because the business could encounter some new risks if this metric gets too high.
The Bottom Line
While returns have fallen for Anax Metals in recent times, we're encouraged to see that sales are growing and that the business is reinvesting in its operations. Furthermore the stock has climbed 73% over the last five years, it would appear that investors are upbeat about the future. So should these growth trends continue, we'd be optimistic on the stock going forward.
Anax Metals does have some risks, we noticed 6 warning signs (and 1 which makes us a bit uncomfortable) we think you should know about.
While Anax Metals isn't earning the highest return, check out this free list of companies that are earning high returns on equity with solid balance sheets.
This article by Simply Wall St is general in nature. We provide commentary based on historical data and analyst forecasts only using an unbiased methodology and our articles are not intended to be financial advice. It does not constitute a recommendation to buy or sell any stock, and does not take account of your objectives, or your financial situation. We aim to bring you long-term focused analysis driven by fundamental data. Note that our analysis may not factor in the latest price-sensitive company announcements or qualitative material. Simply Wall St has no position in any stocks mentioned.
Have feedback on this article? Concerned about the content? Get in touch with us directly. Alternatively, email editorial-team (at) simplywallst.com.
