
 Yahoo Finance
 Returns On Capital Signal Tricky Times Ahead For Schaffer (ASX:SFC)
If you're not sure where to start when looking for the next multi-bagger, there are a few key trends you should keep an eye out for. One common approach is to try and find a company with returns on capital employed (ROCE) that are increasing, in conjunction with a growing amount of capital employed. This shows us that it's a compounding machine, able to continually reinvest its earnings back into the business and generate higher returns. However, after briefly looking over the numbers, we don't think Schaffer (ASX:SFC) has the makings of a multi-bagger going forward, but let's have a look at why that may be.
What Is Return On Capital Employed (ROCE)?
For those that aren't sure what ROCE is, it measures the amount of pre-tax profits a company can generate from the capital employed in its business. Analysts use this formula to calculate it for Schaffer:
Return on Capital Employed = Earnings Before Interest and Tax (EBIT) ÷ (Total Assets - Current Liabilities)
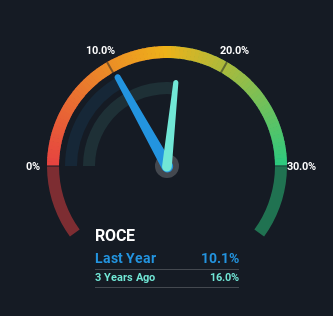
0.10 = AU$33m ÷ (AU$402m - AU$72m) (Based on the trailing twelve months to December 2023).
Therefore, Schaffer has an ROCE of 10%. In absolute terms, that's a pretty normal return, and it's somewhat close to the Auto Components industry average of 12%.
Check out our latest analysis for Schaffer
While the past is not representative of the future, it can be helpful to know how a company has performed historically, which is why we have this chart above. If you want to delve into the historical earnings , check out these free graphs detailing revenue and cash flow performance of Schaffer.
The Trend Of ROCE
In terms of Schaffer's historical ROCE movements, the trend isn't fantastic. To be more specific, ROCE has fallen from 27% over the last five years. However, given capital employed and revenue have both increased it appears that the business is currently pursuing growth, at the consequence of short term returns. If these investments prove successful, this can bode very well for long term stock performance.
The Bottom Line On Schaffer's ROCE
Even though returns on capital have fallen in the short term, we find it promising that revenue and capital employed have both increased for Schaffer. Furthermore the stock has climbed 83% over the last five years, it would appear that investors are upbeat about the future. So while the underlying trends could already be accounted for by investors, we still think this stock is worth looking into further.
Schaffer does come with some risks though, we found 3 warning signs in our investment analysis, and 1 of those is a bit concerning...
If you want to search for solid companies with great earnings, check out this free list of companies with good balance sheets and impressive returns on equity.
Have feedback on this article? Concerned about the content? Get in touch with us directly. Alternatively, email editorial-team (at) simplywallst.com.
This article by Simply Wall St is general in nature. We provide commentary based on historical data and analyst forecasts only using an unbiased methodology and our articles are not intended to be financial advice. It does not constitute a recommendation to buy or sell any stock, and does not take account of your objectives, or your financial situation. We aim to bring you long-term focused analysis driven by fundamental data. Note that our analysis may not factor in the latest price-sensitive company announcements or qualitative material. Simply Wall St has no position in any stocks mentioned.
