
 Yahoo Finance
 Returns On Capital At Spark Power Group (TSE:SPG) Paint A Concerning Picture
To find a multi-bagger stock, what are the underlying trends we should look for in a business? In a perfect world, we'd like to see a company investing more capital into its business and ideally the returns earned from that capital are also increasing. Put simply, these types of businesses are compounding machines, meaning they are continually reinvesting their earnings at ever-higher rates of return. Although, when we looked at Spark Power Group (TSE:SPG), it didn't seem to tick all of these boxes.
What is Return On Capital Employed (ROCE)?
For those that aren't sure what ROCE is, it measures the amount of pre-tax profits a company can generate from the capital employed in its business. The formula for this calculation on Spark Power Group is:
Return on Capital Employed = Earnings Before Interest and Tax (EBIT) ÷ (Total Assets - Current Liabilities)
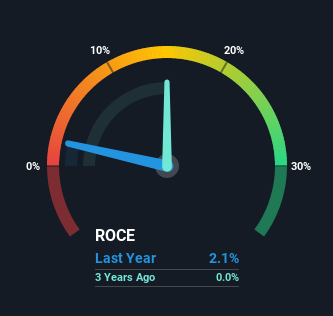
0.021 = CA$2.6m ÷ (CA$211m - CA$90m) (Based on the trailing twelve months to June 2021).
Therefore, Spark Power Group has an ROCE of 2.1%. In absolute terms, that's a low return and it also under-performs the Renewable Energy industry average of 5.6%.
Check out our latest analysis for Spark Power Group
Above you can see how the current ROCE for Spark Power Group compares to its prior returns on capital, but there's only so much you can tell from the past. If you're interested, you can view the analysts predictions in our free report on analyst forecasts for the company.
What Does the ROCE Trend For Spark Power Group Tell Us?
We weren't thrilled with the trend because Spark Power Group's ROCE has reduced by 93% over the last four years, while the business employed 1,539% more capital. Usually this isn't ideal, but given Spark Power Group conducted a capital raising before their most recent earnings announcement, that would've likely contributed, at least partially, to the increased capital employed figure. It's unlikely that all of the funds raised have been put to work yet, so as a consequence Spark Power Group might not have received a full period of earnings contribution from it.
On a related note, Spark Power Group has decreased its current liabilities to 43% of total assets. That could partly explain why the ROCE has dropped. What's more, this can reduce some aspects of risk to the business because now the company's suppliers or short-term creditors are funding less of its operations. Since the business is basically funding more of its operations with it's own money, you could argue this has made the business less efficient at generating ROCE. Either way, they're still at a pretty high level, so we'd like to see them fall further if possible.
In Conclusion...
Even though returns on capital have fallen in the short term, we find it promising that revenue and capital employed have both increased for Spark Power Group. Furthermore the stock has climbed 12% over the last year, it would appear that investors are upbeat about the future. So while the underlying trends could already be accounted for by investors, we still think this stock is worth looking into further.
On a separate note, we've found 2 warning signs for Spark Power Group you'll probably want to know about.
For those who like to invest in solid companies, check out this free list of companies with solid balance sheets and high returns on equity.
This article by Simply Wall St is general in nature. We provide commentary based on historical data and analyst forecasts only using an unbiased methodology and our articles are not intended to be financial advice. It does not constitute a recommendation to buy or sell any stock, and does not take account of your objectives, or your financial situation. We aim to bring you long-term focused analysis driven by fundamental data. Note that our analysis may not factor in the latest price-sensitive company announcements or qualitative material. Simply Wall St has no position in any stocks mentioned.
Have feedback on this article? Concerned about the content? Get in touch with us directly. Alternatively, email editorial-team (at) simplywallst.com.
