
 Yahoo Finance
 Returns On Capital Are A Standout For AnAn International (SGX:Y35)
Finding a business that has the potential to grow substantially is not easy, but it is possible if we look at a few key financial metrics. Firstly, we'd want to identify a growing return on capital employed (ROCE) and then alongside that, an ever-increasing base of capital employed. Put simply, these types of businesses are compounding machines, meaning they are continually reinvesting their earnings at ever-higher rates of return. With that in mind, the ROCE of AnAn International (SGX:Y35) looks great, so lets see what the trend can tell us.
Understanding Return On Capital Employed (ROCE)
For those that aren't sure what ROCE is, it measures the amount of pre-tax profits a company can generate from the capital employed in its business. To calculate this metric for AnAn International, this is the formula:
Return on Capital Employed = Earnings Before Interest and Tax (EBIT) ÷ (Total Assets - Current Liabilities)
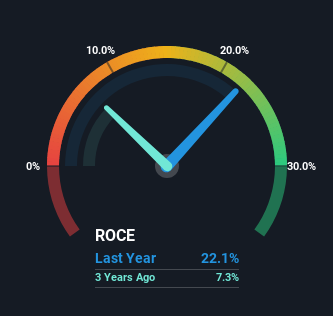
0.22 = US$43m ÷ (US$601m - US$408m) (Based on the trailing twelve months to September 2023).
Thus, AnAn International has an ROCE of 22%. In absolute terms that's a great return and it's even better than the Oil and Gas industry average of 15%.
View our latest analysis for AnAn International
While the past is not representative of the future, it can be helpful to know how a company has performed historically, which is why we have this chart above. If you'd like to look at how AnAn International has performed in the past in other metrics, you can view this free graph of past earnings, revenue and cash flow.
What Does the ROCE Trend For AnAn International Tell Us?
The fact that AnAn International is now generating some pre-tax profits from its prior investments is very encouraging. Shareholders would no doubt be pleased with this because the business was loss-making five years ago but is is now generating 22% on its capital. In addition to that, AnAn International is employing 59% more capital than previously which is expected of a company that's trying to break into profitability. This can tell us that the company has plenty of reinvestment opportunities that are able to generate higher returns.
On a side note, AnAn International's current liabilities are still rather high at 68% of total assets. This can bring about some risks because the company is basically operating with a rather large reliance on its suppliers or other sorts of short-term creditors. Ideally we'd like to see this reduce as that would mean fewer obligations bearing risks.
The Bottom Line
In summary, it's great to see that AnAn International has managed to break into profitability and is continuing to reinvest in its business. Since the stock has returned a staggering 433% to shareholders over the last five years, it looks like investors are recognizing these changes. In light of that, we think it's worth looking further into this stock because if AnAn International can keep these trends up, it could have a bright future ahead.
On a separate note, we've found 4 warning signs for AnAn International you'll probably want to know about.
If you want to search for more stocks that have been earning high returns, check out this free list of stocks with solid balance sheets that are also earning high returns on equity.
Have feedback on this article? Concerned about the content? Get in touch with us directly. Alternatively, email editorial-team (at) simplywallst.com.
This article by Simply Wall St is general in nature. We provide commentary based on historical data and analyst forecasts only using an unbiased methodology and our articles are not intended to be financial advice. It does not constitute a recommendation to buy or sell any stock, and does not take account of your objectives, or your financial situation. We aim to bring you long-term focused analysis driven by fundamental data. Note that our analysis may not factor in the latest price-sensitive company announcements or qualitative material. Simply Wall St has no position in any stocks mentioned.
