
 Yahoo Finance
 Returns On Capital Are A Standout For Tribal Group (LON:TRB)
There are a few key trends to look for if we want to identify the next multi-bagger. One common approach is to try and find a company with returns on capital employed (ROCE) that are increasing, in conjunction with a growing amount of capital employed. If you see this, it typically means it's a company with a great business model and plenty of profitable reinvestment opportunities. Speaking of which, we noticed some great changes in Tribal Group's (LON:TRB) returns on capital, so let's have a look.
Understanding Return On Capital Employed (ROCE)
If you haven't worked with ROCE before, it measures the 'return' (pre-tax profit) a company generates from capital employed in its business. The formula for this calculation on Tribal Group is:
Return on Capital Employed = Earnings Before Interest and Tax (EBIT) ÷ (Total Assets - Current Liabilities)
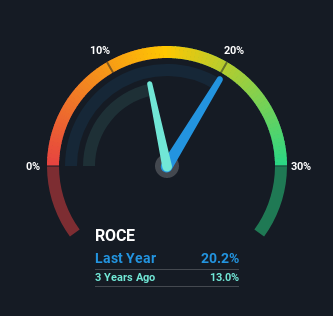
0.20 = UK£9.0m ÷ (UK£85m - UK£41m) (Based on the trailing twelve months to December 2020).
Therefore, Tribal Group has an ROCE of 20%. That's a fantastic return and not only that, it outpaces the average of 13% earned by companies in a similar industry.
See our latest analysis for Tribal Group
In the above chart we have measured Tribal Group's prior ROCE against its prior performance, but the future is arguably more important. If you'd like to see what analysts are forecasting going forward, you should check out our free report for Tribal Group.
How Are Returns Trending?
Tribal Group's ROCE growth is quite impressive. Looking at the data, we can see that even though capital employed in the business has remained relatively flat, the ROCE generated has risen by 648% over the last five years. So it's likely that the business is now reaping the full benefits of its past investments, since the capital employed hasn't changed considerably. The company is doing well in that sense, and it's worth investigating what the management team has planned for long term growth prospects.
Another thing to note, Tribal Group has a high ratio of current liabilities to total assets of 48%. This effectively means that suppliers (or short-term creditors) are funding a large portion of the business, so just be aware that this can introduce some elements of risk. While it's not necessarily a bad thing, it can be beneficial if this ratio is lower.
The Bottom Line
As discussed above, Tribal Group appears to be getting more proficient at generating returns since capital employed has remained flat but earnings (before interest and tax) are up. And with a respectable 93% awarded to those who held the stock over the last five years, you could argue that these developments are starting to get the attention they deserve. So given the stock has proven it has promising trends, it's worth researching the company further to see if these trends are likely to persist.
Since virtually every company faces some risks, it's worth knowing what they are, and we've spotted 4 warning signs for Tribal Group (of which 1 is significant!) that you should know about.
If you'd like to see other companies earning high returns, check out our free list of companies earning high returns with solid balance sheets here.
This article by Simply Wall St is general in nature. It does not constitute a recommendation to buy or sell any stock, and does not take account of your objectives, or your financial situation. We aim to bring you long-term focused analysis driven by fundamental data. Note that our analysis may not factor in the latest price-sensitive company announcements or qualitative material. Simply Wall St has no position in any stocks mentioned.
Have feedback on this article? Concerned about the content? Get in touch with us directly. Alternatively, email editorial-team (at) simplywallst.com.
