
 Yahoo Finance
 The Returns On Capital At SYZYGY (ETR:SYZ) Don't Inspire Confidence
When we're researching a company, it's sometimes hard to find the warning signs, but there are some financial metrics that can help spot trouble early. A business that's potentially in decline often shows two trends, a return on capital employed (ROCE) that's declining, and a base of capital employed that's also declining. This combination can tell you that not only is the company investing less, it's earning less on what it does invest. Having said that, after a brief look, SYZYGY (ETR:SYZ) we aren't filled with optimism, but let's investigate further.
What Is Return On Capital Employed (ROCE)?
If you haven't worked with ROCE before, it measures the 'return' (pre-tax profit) a company generates from capital employed in its business. To calculate this metric for SYZYGY, this is the formula:
Return on Capital Employed = Earnings Before Interest and Tax (EBIT) ÷ (Total Assets - Current Liabilities)
0.001 = €65k ÷ (€91m - €28m) (Based on the trailing twelve months to June 2023).
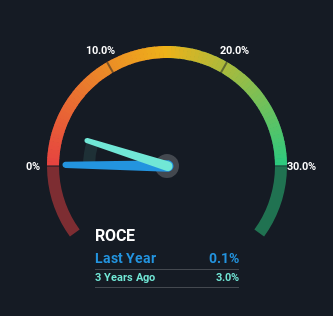
So, SYZYGY has an ROCE of 0.1%. In absolute terms, that's a low return and it also under-performs the Media industry average of 9.6%.
View our latest analysis for SYZYGY
In the above chart we have measured SYZYGY's prior ROCE against its prior performance, but the future is arguably more important. If you'd like to see what analysts are forecasting going forward, you should check out our free report for SYZYGY.
What Does the ROCE Trend For SYZYGY Tell Us?
We are a bit worried about the trend of returns on capital at SYZYGY. About five years ago, returns on capital were 2.2%, however they're now substantially lower than that as we saw above. Meanwhile, capital employed in the business has stayed roughly the flat over the period. Companies that exhibit these attributes tend to not be shrinking, but they can be mature and facing pressure on their margins from competition. If these trends continue, we wouldn't expect SYZYGY to turn into a multi-bagger.
The Bottom Line On SYZYGY's ROCE
In the end, the trend of lower returns on the same amount of capital isn't typically an indication that we're looking at a growth stock. Investors haven't taken kindly to these developments, since the stock has declined 55% from where it was five years ago. With underlying trends that aren't great in these areas, we'd consider looking elsewhere.
If you'd like to know more about SYZYGY, we've spotted 3 warning signs, and 1 of them is a bit unpleasant.
For those who like to invest in solid companies, check out this free list of companies with solid balance sheets and high returns on equity.
Have feedback on this article? Concerned about the content? Get in touch with us directly. Alternatively, email editorial-team (at) simplywallst.com.
This article by Simply Wall St is general in nature. We provide commentary based on historical data and analyst forecasts only using an unbiased methodology and our articles are not intended to be financial advice. It does not constitute a recommendation to buy or sell any stock, and does not take account of your objectives, or your financial situation. We aim to bring you long-term focused analysis driven by fundamental data. Note that our analysis may not factor in the latest price-sensitive company announcements or qualitative material. Simply Wall St has no position in any stocks mentioned.
