
 Yahoo Finance
 The Returns On Capital At Trans-Siberian Gold (LON:TSG) Don't Inspire Confidence
If we're looking to avoid a business that is in decline, what are the trends that can warn us ahead of time? More often than not, we'll see a declining return on capital employed (ROCE) and a declining amount of capital employed. Ultimately this means that the company is earning less per dollar invested and on top of that, it's shrinking its base of capital employed. So after we looked into Trans-Siberian Gold (LON:TSG), the trends above didn't look too great.
Return On Capital Employed (ROCE): What is it?
For those that aren't sure what ROCE is, it measures the amount of pre-tax profits a company can generate from the capital employed in its business. To calculate this metric for Trans-Siberian Gold, this is the formula:
Return on Capital Employed = Earnings Before Interest and Tax (EBIT) ÷ (Total Assets - Current Liabilities)
0.11 = US$10m ÷ (US$117m - US$23m) (Based on the trailing twelve months to June 2020).
So, Trans-Siberian Gold has an ROCE of 11%. That's a relatively normal return on capital, and it's around the 12% generated by the Metals and Mining industry.
View our latest analysis for Trans-Siberian Gold
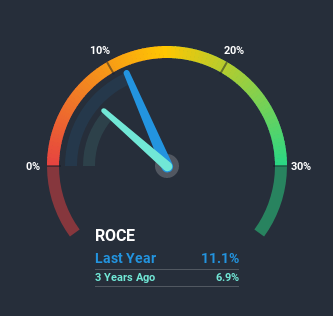
Above you can see how the current ROCE for Trans-Siberian Gold compares to its prior returns on capital, but there's only so much you can tell from the past. If you'd like to see what analysts are forecasting going forward, you should check out our free report for Trans-Siberian Gold.
The Trend Of ROCE
In terms of Trans-Siberian Gold's historical ROCE movements, the trend doesn't inspire confidence. Unfortunately the returns on capital have diminished from the 18% that they were earning five years ago. On top of that, it's worth noting that the amount of capital employed within the business has remained relatively steady. This combination can be indicative of a mature business that still has areas to deploy capital, but the returns received aren't as high due potentially to new competition or smaller margins. So because these trends aren't typically conducive to creating a multi-bagger, we wouldn't hold our breath on Trans-Siberian Gold becoming one if things continue as they have.
While on the subject, we noticed that the ratio of current liabilities to total assets has risen to 20%, which has impacted the ROCE. If current liabilities hadn't increased as much as they did, the ROCE could actually be even lower. Keep an eye on this ratio, because the business could encounter some new risks if this metric gets too high.
What We Can Learn From Trans-Siberian Gold's ROCE
In summary, it's unfortunate that Trans-Siberian Gold is generating lower returns from the same amount of capital. Yet despite these poor fundamentals, the stock has gained a huge 1,038% over the last five years, so investors appear very optimistic. In any case, the current underlying trends don't bode well for long term performance so unless they reverse, we'd start looking elsewhere.
One more thing to note, we've identified 3 warning signs with Trans-Siberian Gold and understanding these should be part of your investment process.
For those who like to invest in solid companies, check out this free list of companies with solid balance sheets and high returns on equity.
This article by Simply Wall St is general in nature. It does not constitute a recommendation to buy or sell any stock, and does not take account of your objectives, or your financial situation. We aim to bring you long-term focused analysis driven by fundamental data. Note that our analysis may not factor in the latest price-sensitive company announcements or qualitative material. Simply Wall St has no position in any stocks mentioned.
Have feedback on this article? Concerned about the content? Get in touch with us directly. Alternatively, email editorial-team@simplywallst.com.
