
 Yahoo Finance
 Returns On Capital At United Malt Group (ASX:UMG) Paint A Concerning Picture
What trends should we look for it we want to identify stocks that can multiply in value over the long term? In a perfect world, we'd like to see a company investing more capital into its business and ideally the returns earned from that capital are also increasing. Basically this means that a company has profitable initiatives that it can continue to reinvest in, which is a trait of a compounding machine. However, after briefly looking over the numbers, we don't think United Malt Group (ASX:UMG) has the makings of a multi-bagger going forward, but let's have a look at why that may be.
What is Return On Capital Employed (ROCE)?
For those who don't know, ROCE is a measure of a company's yearly pre-tax profit (its return), relative to the capital employed in the business. The formula for this calculation on United Malt Group is:
Return on Capital Employed = Earnings Before Interest and Tax (EBIT) ÷ (Total Assets - Current Liabilities)
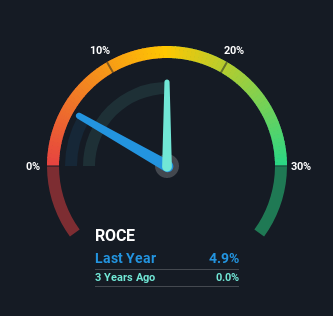
0.049 = AU$76m ÷ (AU$1.8b - AU$304m) (Based on the trailing twelve months to March 2021).
Thus, United Malt Group has an ROCE of 4.9%. In absolute terms, that's a low return but it's around the Food industry average of 5.7%.
See our latest analysis for United Malt Group
Above you can see how the current ROCE for United Malt Group compares to its prior returns on capital, but there's only so much you can tell from the past. If you'd like, you can check out the forecasts from the analysts covering United Malt Group here for free.
The Trend Of ROCE
The trend of ROCE doesn't look fantastic because it's fallen from 9.4% one year ago, while the business's capital employed increased by 30%. Usually this isn't ideal, but given United Malt Group conducted a capital raising before their most recent earnings announcement, that would've likely contributed, at least partially, to the increased capital employed figure. It's unlikely that all of the funds raised have been put to work yet, so as a consequence United Malt Group might not have received a full period of earnings contribution from it.
On a related note, United Malt Group has decreased its current liabilities to 16% of total assets. That could partly explain why the ROCE has dropped. What's more, this can reduce some aspects of risk to the business because now the company's suppliers or short-term creditors are funding less of its operations. Since the business is basically funding more of its operations with it's own money, you could argue this has made the business less efficient at generating ROCE.
The Bottom Line On United Malt Group's ROCE
In summary, United Malt Group is reinvesting funds back into the business for growth but unfortunately it looks like sales haven't increased much just yet. Unsurprisingly then, the total return to shareholders over the last year has been flat. All in all, the inherent trends aren't typical of multi-baggers, so if that's what you're after, we think you might have more luck elsewhere.
If you want to continue researching United Malt Group, you might be interested to know about the 2 warning signs that our analysis has discovered.
For those who like to invest in solid companies, check out this free list of companies with solid balance sheets and high returns on equity.
This article by Simply Wall St is general in nature. We provide commentary based on historical data and analyst forecasts only using an unbiased methodology and our articles are not intended to be financial advice. It does not constitute a recommendation to buy or sell any stock, and does not take account of your objectives, or your financial situation. We aim to bring you long-term focused analysis driven by fundamental data. Note that our analysis may not factor in the latest price-sensitive company announcements or qualitative material. Simply Wall St has no position in any stocks mentioned.
Have feedback on this article? Concerned about the content? Get in touch with us directly. Alternatively, email editorial-team (at) simplywallst.com.
