
 Yahoo Finance
 The Returns On Capital At Viscom (ETR:V6C) Don't Inspire Confidence
When it comes to investing, there are some useful financial metrics that can warn us when a business is potentially in trouble. A business that's potentially in decline often shows two trends, a return on capital employed (ROCE) that's declining, and a base of capital employed that's also declining. Trends like this ultimately mean the business is reducing its investments and also earning less on what it has invested. So after we looked into Viscom (ETR:V6C), the trends above didn't look too great.
What Is Return On Capital Employed (ROCE)?
Just to clarify if you're unsure, ROCE is a metric for evaluating how much pre-tax income (in percentage terms) a company earns on the capital invested in its business. Analysts use this formula to calculate it for Viscom:
Return on Capital Employed = Earnings Before Interest and Tax (EBIT) ÷ (Total Assets - Current Liabilities)
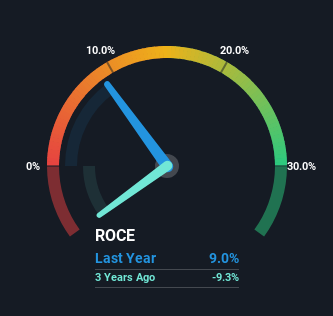
0.09 = €6.7m ÷ (€126m - €51m) (Based on the trailing twelve months to December 2023).
Thus, Viscom has an ROCE of 9.0%. In absolute terms, that's a low return but it's around the Electronic industry average of 11%.
See our latest analysis for Viscom
Above you can see how the current ROCE for Viscom compares to its prior returns on capital, but there's only so much you can tell from the past. If you'd like to see what analysts are forecasting going forward, you should check out our free analyst report for Viscom .
The Trend Of ROCE
There is reason to be cautious about Viscom, given the returns are trending downwards. To be more specific, the ROCE was 17% five years ago, but since then it has dropped noticeably. On top of that, it's worth noting that the amount of capital employed within the business has remained relatively steady. Companies that exhibit these attributes tend to not be shrinking, but they can be mature and facing pressure on their margins from competition. If these trends continue, we wouldn't expect Viscom to turn into a multi-bagger.
While on the subject, we noticed that the ratio of current liabilities to total assets has risen to 41%, which has impacted the ROCE. Without this increase, it's likely that ROCE would be even lower than 9.0%. What this means is that in reality, a rather large portion of the business is being funded by the likes of the company's suppliers or short-term creditors, which can bring some risks of its own.
Our Take On Viscom's ROCE
All in all, the lower returns from the same amount of capital employed aren't exactly signs of a compounding machine. Long term shareholders who've owned the stock over the last five years have experienced a 56% depreciation in their investment, so it appears the market might not like these trends either. That being the case, unless the underlying trends revert to a more positive trajectory, we'd consider looking elsewhere.
Since virtually every company faces some risks, it's worth knowing what they are, and we've spotted 3 warning signs for Viscom (of which 1 can't be ignored!) that you should know about.
While Viscom may not currently earn the highest returns, we've compiled a list of companies that currently earn more than 25% return on equity. Check out this free list here.
Have feedback on this article? Concerned about the content? Get in touch with us directly. Alternatively, email editorial-team (at) simplywallst.com.
This article by Simply Wall St is general in nature. We provide commentary based on historical data and analyst forecasts only using an unbiased methodology and our articles are not intended to be financial advice. It does not constitute a recommendation to buy or sell any stock, and does not take account of your objectives, or your financial situation. We aim to bring you long-term focused analysis driven by fundamental data. Note that our analysis may not factor in the latest price-sensitive company announcements or qualitative material. Simply Wall St has no position in any stocks mentioned.
