
 Yahoo Finance
 Returns At Ceapro (CVE:CZO) Are On The Way Up
Finding a business that has the potential to grow substantially is not easy, but it is possible if we look at a few key financial metrics. In a perfect world, we'd like to see a company investing more capital into its business and ideally the returns earned from that capital are also increasing. This shows us that it's a compounding machine, able to continually reinvest its earnings back into the business and generate higher returns. With that in mind, we've noticed some promising trends at Ceapro (CVE:CZO) so let's look a bit deeper.
Return On Capital Employed (ROCE): What Is It?
For those who don't know, ROCE is a measure of a company's yearly pre-tax profit (its return), relative to the capital employed in the business. Analysts use this formula to calculate it for Ceapro:
Return on Capital Employed = Earnings Before Interest and Tax (EBIT) ÷ (Total Assets - Current Liabilities)
0.17 = CA$6.0m ÷ (CA$36m - CA$842k) (Based on the trailing twelve months to September 2022).
So, Ceapro has an ROCE of 17%. In absolute terms, that's a pretty normal return, and it's somewhat close to the Chemicals industry average of 16%.
See our latest analysis for Ceapro
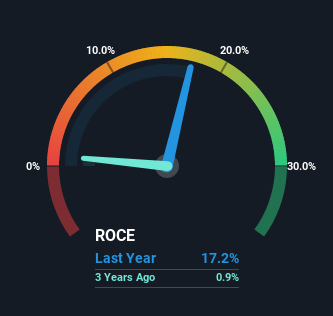
Historical performance is a great place to start when researching a stock so above you can see the gauge for Ceapro's ROCE against it's prior returns. If you're interested in investigating Ceapro's past further, check out this free graph of past earnings, revenue and cash flow.
What The Trend Of ROCE Can Tell Us
Ceapro is displaying some positive trends. The numbers show that in the last five years, the returns generated on capital employed have grown considerably to 17%. Basically the business is earning more per dollar of capital invested and in addition to that, 37% more capital is being employed now too. This can indicate that there's plenty of opportunities to invest capital internally and at ever higher rates, a combination that's common among multi-baggers.
In Conclusion...
All in all, it's terrific to see that Ceapro is reaping the rewards from prior investments and is growing its capital base. Considering the stock has delivered 26% to its stockholders over the last five years, it may be fair to think that investors aren't fully aware of the promising trends yet. So with that in mind, we think the stock deserves further research.
If you want to continue researching Ceapro, you might be interested to know about the 1 warning sign that our analysis has discovered.
If you want to search for solid companies with great earnings, check out this free list of companies with good balance sheets and impressive returns on equity.
Have feedback on this article? Concerned about the content? Get in touch with us directly. Alternatively, email editorial-team (at) simplywallst.com.
This article by Simply Wall St is general in nature. We provide commentary based on historical data and analyst forecasts only using an unbiased methodology and our articles are not intended to be financial advice. It does not constitute a recommendation to buy or sell any stock, and does not take account of your objectives, or your financial situation. We aim to bring you long-term focused analysis driven by fundamental data. Note that our analysis may not factor in the latest price-sensitive company announcements or qualitative material. Simply Wall St has no position in any stocks mentioned.
Join A Paid User Research Session
You’ll receive a US$30 Amazon Gift card for 1 hour of your time while helping us build better investing tools for the individual investors like yourself. Sign up here
