
 Yahoo Finance
 The Returns At Costa Group Holdings (ASX:CGC) Provide Us With Signs Of What's To Come

Want to participate in a short research study? Help shape the future of investing tools and earn a $40 gift card!
There are a few key trends to look for if we want to identify the next multi-bagger. Typically, we'll want to notice a trend of growing return on capital employed (ROCE) and alongside that, an expanding base of capital employed. If you see this, it typically means it's a company with a great business model and plenty of profitable reinvestment opportunities. Having said that, from a first glance at Costa Group Holdings (ASX:CGC) we aren't jumping out of our chairs at how returns are trending, but let's have a deeper look.
What is Return On Capital Employed (ROCE)?
Just to clarify if you're unsure, ROCE is a metric for evaluating how much pre-tax income (in percentage terms) a company earns on the capital invested in its business. To calculate this metric for Costa Group Holdings, this is the formula:
Return on Capital Employed = Earnings Before Interest and Tax (EBIT) ÷ (Total Assets - Current Liabilities)
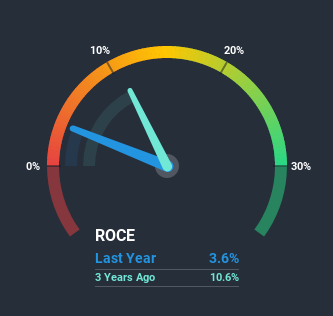
0.036 = AU$39m ÷ (AU$1.2b - AU$183m) (Based on the trailing twelve months to December 2019).
So, Costa Group Holdings has an ROCE of 3.6%. Ultimately, that's a low return and it under-performs the Food industry average of 4.7%.
View our latest analysis for Costa Group Holdings
In the above chart we have a measured Costa Group Holdings' prior ROCE against its prior performance, but the future is arguably more important. If you're interested, you can view the analysts predictions in our free report on analyst forecasts for the company.
What Does the ROCE Trend For Costa Group Holdings Tell Us?
On the surface, the trend of ROCE at Costa Group Holdings doesn't inspire confidence. To be more specific, ROCE has fallen from 7.7% over the last five years. On the other hand, the company has been employing more capital without a corresponding improvement in sales in the last year, which could suggest these investments are longer term plays. It may take some time before the company starts to see any change in earnings from these investments.
In Conclusion...
To conclude, we've found that Costa Group Holdings is reinvesting in the business, but returns have been falling. And investors appear hesitant that the trends will pick up because the stock has fallen 34% in the last three years. In any case, the stock doesn't have these traits of a multi-bagger discussed above, so if that's what you're looking for, we think you'd have more luck elsewhere.
On a separate note, we've found 2 warning signs for Costa Group Holdings you'll probably want to know about.
If you want to search for solid companies with great earnings, check out this free list of companies with good balance sheets and impressive returns on equity.
This article by Simply Wall St is general in nature. It does not constitute a recommendation to buy or sell any stock, and does not take account of your objectives, or your financial situation. We aim to bring you long-term focused analysis driven by fundamental data. Note that our analysis may not factor in the latest price-sensitive company announcements or qualitative material. Simply Wall St has no position in any stocks mentioned.
Have feedback on this article? Concerned about the content? Get in touch with us directly. Alternatively, email editorial-team@simplywallst.com.
