
 Yahoo Finance
 Returns At DP Aircraft I (LON:DPA) Appear To Be Weighed Down
Finding a business that has the potential to grow substantially is not easy, but it is possible if we look at a few key financial metrics. Ideally, a business will show two trends; firstly a growing return on capital employed (ROCE) and secondly, an increasing amount of capital employed. Basically this means that a company has profitable initiatives that it can continue to reinvest in, which is a trait of a compounding machine. However, after investigating DP Aircraft I (LON:DPA), we don't think it's current trends fit the mold of a multi-bagger.
Understanding Return On Capital Employed (ROCE)
For those that aren't sure what ROCE is, it measures the amount of pre-tax profits a company can generate from the capital employed in its business. The formula for this calculation on DP Aircraft I is:
Return on Capital Employed = Earnings Before Interest and Tax (EBIT) ÷ (Total Assets - Current Liabilities)
0.072 = US$11m ÷ (US$153m - US$6.3m) (Based on the trailing twelve months to June 2023).
Therefore, DP Aircraft I has an ROCE of 7.2%. Ultimately, that's a low return and it under-performs the Trade Distributors industry average of 14%.
See our latest analysis for DP Aircraft I
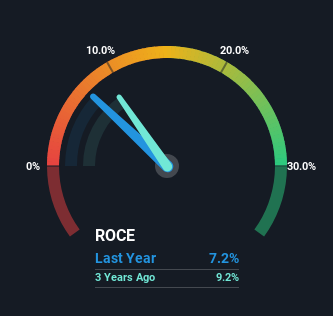
Historical performance is a great place to start when researching a stock so above you can see the gauge for DP Aircraft I's ROCE against it's prior returns. If you'd like to look at how DP Aircraft I has performed in the past in other metrics, you can view this free graph of past earnings, revenue and cash flow.
What Does the ROCE Trend For DP Aircraft I Tell Us?
Over the past five years, DP Aircraft I's ROCE has remained relatively flat while the business is using 68% less capital than before. This indicates to us that assets are being sold and thus the business is likely shrinking, which you'll remember isn't the typical ingredients for an up-and-coming multi-bagger. In addition to that, since the ROCE doesn't scream "quality" at 7.2%, it's hard to get excited about these developments.
What We Can Learn From DP Aircraft I's ROCE
Overall, we're not ecstatic to see DP Aircraft I reducing the amount of capital it employs in the business. It seems that investors have little hope of these trends getting any better and that may have partly contributed to the stock collapsing 93% in the last five years. In any case, the stock doesn't have these traits of a multi-bagger discussed above, so if that's what you're looking for, we think you'd have more luck elsewhere.
One final note, you should learn about the 4 warning signs we've spotted with DP Aircraft I (including 1 which is significant) .
For those who like to invest in solid companies, check out this free list of companies with solid balance sheets and high returns on equity.
Have feedback on this article? Concerned about the content? Get in touch with us directly. Alternatively, email editorial-team (at) simplywallst.com.
This article by Simply Wall St is general in nature. We provide commentary based on historical data and analyst forecasts only using an unbiased methodology and our articles are not intended to be financial advice. It does not constitute a recommendation to buy or sell any stock, and does not take account of your objectives, or your financial situation. We aim to bring you long-term focused analysis driven by fundamental data. Note that our analysis may not factor in the latest price-sensitive company announcements or qualitative material. Simply Wall St has no position in any stocks mentioned.
