
 Yahoo Finance
 Returns At Eagle Eye Solutions Group (LON:EYE) Are On The Way Up
What are the early trends we should look for to identify a stock that could multiply in value over the long term? Amongst other things, we'll want to see two things; firstly, a growing return on capital employed (ROCE) and secondly, an expansion in the company's amount of capital employed. Ultimately, this demonstrates that it's a business that is reinvesting profits at increasing rates of return. Speaking of which, we noticed some great changes in Eagle Eye Solutions Group's (LON:EYE) returns on capital, so let's have a look.
What Is Return On Capital Employed (ROCE)?
Just to clarify if you're unsure, ROCE is a metric for evaluating how much pre-tax income (in percentage terms) a company earns on the capital invested in its business. To calculate this metric for Eagle Eye Solutions Group, this is the formula:
Return on Capital Employed = Earnings Before Interest and Tax (EBIT) ÷ (Total Assets - Current Liabilities)
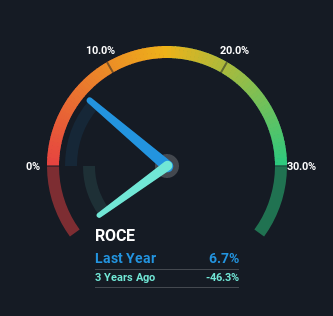
0.067 = UK£734k ÷ (UK£23m - UK£12m) (Based on the trailing twelve months to June 2022).
Therefore, Eagle Eye Solutions Group has an ROCE of 6.7%. Ultimately, that's a low return and it under-performs the IT industry average of 9.9%.
View our latest analysis for Eagle Eye Solutions Group
Above you can see how the current ROCE for Eagle Eye Solutions Group compares to its prior returns on capital, but there's only so much you can tell from the past. If you'd like to see what analysts are forecasting going forward, you should check out our free report for Eagle Eye Solutions Group.
What Does the ROCE Trend For Eagle Eye Solutions Group Tell Us?
We're delighted to see that Eagle Eye Solutions Group is reaping rewards from its investments and is now generating some pre-tax profits. Shareholders would no doubt be pleased with this because the business was loss-making five years ago but is is now generating 6.7% on its capital. And unsurprisingly, like most companies trying to break into the black, Eagle Eye Solutions Group is utilizing 21% more capital than it was five years ago. This can indicate that there's plenty of opportunities to invest capital internally and at ever higher rates, both common traits of a multi-bagger.
On a side note, we noticed that the improvement in ROCE appears to be partly fueled by an increase in current liabilities. Effectively this means that suppliers or short-term creditors are now funding 53% of the business, which is more than it was five years ago. Given it's pretty high ratio, we'd remind investors that having current liabilities at those levels can bring about some risks in certain businesses.
The Key Takeaway
In summary, it's great to see that Eagle Eye Solutions Group has managed to break into profitability and is continuing to reinvest in its business. Since the stock has returned a staggering 168% to shareholders over the last five years, it looks like investors are recognizing these changes. Therefore, we think it would be worth your time to check if these trends are going to continue.
While Eagle Eye Solutions Group looks impressive, no company is worth an infinite price. The intrinsic value infographic in our free research report helps visualize whether EYE is currently trading for a fair price.
While Eagle Eye Solutions Group isn't earning the highest return, check out this free list of companies that are earning high returns on equity with solid balance sheets.
Have feedback on this article? Concerned about the content? Get in touch with us directly. Alternatively, email editorial-team (at) simplywallst.com.
This article by Simply Wall St is general in nature. We provide commentary based on historical data and analyst forecasts only using an unbiased methodology and our articles are not intended to be financial advice. It does not constitute a recommendation to buy or sell any stock, and does not take account of your objectives, or your financial situation. We aim to bring you long-term focused analysis driven by fundamental data. Note that our analysis may not factor in the latest price-sensitive company announcements or qualitative material. Simply Wall St has no position in any stocks mentioned.
Join A Paid User Research Session
You’ll receive a US$30 Amazon Gift card for 1 hour of your time while helping us build better investing tools for the individual investors like yourself. Sign up here
