
 Yahoo Finance
 Returns Are Gaining Momentum At Balfour Beatty (LON:BBY)
If we want to find a potential multi-bagger, often there are underlying trends that can provide clues. Ideally, a business will show two trends; firstly a growing return on capital employed (ROCE) and secondly, an increasing amount of capital employed. If you see this, it typically means it's a company with a great business model and plenty of profitable reinvestment opportunities. With that in mind, we've noticed some promising trends at Balfour Beatty (LON:BBY) so let's look a bit deeper.
Understanding Return On Capital Employed (ROCE)
If you haven't worked with ROCE before, it measures the 'return' (pre-tax profit) a company generates from capital employed in its business. To calculate this metric for Balfour Beatty, this is the formula:
Return on Capital Employed = Earnings Before Interest and Tax (EBIT) ÷ (Total Assets - Current Liabilities)
0.0036 = UK£9.0m ÷ (UK£4.7b - UK£2.2b) (Based on the trailing twelve months to December 2020).
So, Balfour Beatty has an ROCE of 0.4%. In absolute terms, that's a low return and it also under-performs the Construction industry average of 11%.
Check out our latest analysis for Balfour Beatty
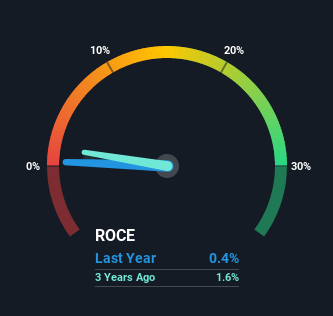
Above you can see how the current ROCE for Balfour Beatty compares to its prior returns on capital, but there's only so much you can tell from the past. If you're interested, you can view the analysts predictions in our free report on analyst forecasts for the company.
How Are Returns Trending?
Shareholders will be relieved that Balfour Beatty has broken into profitability. The company now earns 0.4% on its capital, because five years ago it was incurring losses. Interestingly, the capital employed by the business has remained relatively flat, so these higher returns are either from prior investments paying off or increased efficiencies. That being said, while an increase in efficiency is no doubt appealing, it'd be helpful to know if the company does have any investment plans going forward. So if you're looking for high growth, you'll want to see a business's capital employed also increasing.
On a side note, Balfour Beatty's current liabilities are still rather high at 47% of total assets. This can bring about some risks because the company is basically operating with a rather large reliance on its suppliers or other sorts of short-term creditors. Ideally we'd like to see this reduce as that would mean fewer obligations bearing risks.
The Bottom Line On Balfour Beatty's ROCE
In summary, we're delighted to see that Balfour Beatty has been able to increase efficiencies and earn higher rates of return on the same amount of capital. Since the stock has only returned 38% to shareholders over the last five years, the promising fundamentals may not be recognized yet by investors. So exploring more about this stock could uncover a good opportunity, if the valuation and other metrics stack up.
If you'd like to know more about Balfour Beatty, we've spotted 3 warning signs, and 1 of them can't be ignored.
For those who like to invest in solid companies, check out this free list of companies with solid balance sheets and high returns on equity.
This article by Simply Wall St is general in nature. It does not constitute a recommendation to buy or sell any stock, and does not take account of your objectives, or your financial situation. We aim to bring you long-term focused analysis driven by fundamental data. Note that our analysis may not factor in the latest price-sensitive company announcements or qualitative material. Simply Wall St has no position in any stocks mentioned.
Have feedback on this article? Concerned about the content? Get in touch with us directly. Alternatively, email editorial-team (at) simplywallst.com.
