
 Yahoo Finance
 Returns Are Gaining Momentum At Caffyns (LON:CFYN)
There are a few key trends to look for if we want to identify the next multi-bagger. Amongst other things, we'll want to see two things; firstly, a growing return on capital employed (ROCE) and secondly, an expansion in the company's amount of capital employed. If you see this, it typically means it's a company with a great business model and plenty of profitable reinvestment opportunities. So when we looked at Caffyns (LON:CFYN) and its trend of ROCE, we really liked what we saw.
Return On Capital Employed (ROCE): What Is It?
For those who don't know, ROCE is a measure of a company's yearly pre-tax profit (its return), relative to the capital employed in the business. The formula for this calculation on Caffyns is:
Return on Capital Employed = Earnings Before Interest and Tax (EBIT) ÷ (Total Assets - Current Liabilities)
0.076 = UK£4.1m ÷ (UK£98m - UK£45m) (Based on the trailing twelve months to September 2023).
So, Caffyns has an ROCE of 7.6%. In absolute terms, that's a low return and it also under-performs the Specialty Retail industry average of 14%.
See our latest analysis for Caffyns
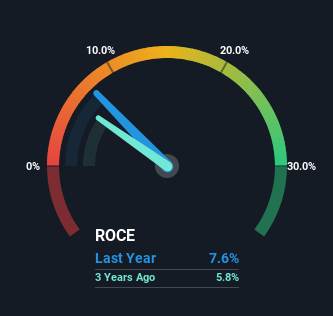
Historical performance is a great place to start when researching a stock so above you can see the gauge for Caffyns' ROCE against it's prior returns. If you'd like to look at how Caffyns has performed in the past in other metrics, you can view this free graph of Caffyns' past earnings, revenue and cash flow.
What Does the ROCE Trend For Caffyns Tell Us?
Caffyns is showing promise given that its ROCE is trending up and to the right. Looking at the data, we can see that even though capital employed in the business has remained relatively flat, the ROCE generated has risen by 40% over the last five years. Basically the business is generating higher returns from the same amount of capital and that is proof that there are improvements in the company's efficiencies. It's worth looking deeper into this though because while it's great that the business is more efficient, it might also mean that going forward the areas to invest internally for the organic growth are lacking.
On a separate but related note, it's important to know that Caffyns has a current liabilities to total assets ratio of 45%, which we'd consider pretty high. This effectively means that suppliers (or short-term creditors) are funding a large portion of the business, so just be aware that this can introduce some elements of risk. While it's not necessarily a bad thing, it can be beneficial if this ratio is lower.
The Key Takeaway
To sum it up, Caffyns is collecting higher returns from the same amount of capital, and that's impressive. Considering the stock has delivered 36% to its stockholders over the last five years, it may be fair to think that investors aren't fully aware of the promising trends yet. So with that in mind, we think the stock deserves further research.
On a separate note, we've found 3 warning signs for Caffyns you'll probably want to know about.
While Caffyns may not currently earn the highest returns, we've compiled a list of companies that currently earn more than 25% return on equity. Check out this free list here.
Have feedback on this article? Concerned about the content? Get in touch with us directly. Alternatively, email editorial-team (at) simplywallst.com.
This article by Simply Wall St is general in nature. We provide commentary based on historical data and analyst forecasts only using an unbiased methodology and our articles are not intended to be financial advice. It does not constitute a recommendation to buy or sell any stock, and does not take account of your objectives, or your financial situation. We aim to bring you long-term focused analysis driven by fundamental data. Note that our analysis may not factor in the latest price-sensitive company announcements or qualitative material. Simply Wall St has no position in any stocks mentioned.
