
 Yahoo Finance
 Returns Are Gaining Momentum At freenet (ETR:FNTN)
Finding a business that has the potential to grow substantially is not easy, but it is possible if we look at a few key financial metrics. In a perfect world, we'd like to see a company investing more capital into its business and ideally the returns earned from that capital are also increasing. Ultimately, this demonstrates that it's a business that is reinvesting profits at increasing rates of return. So on that note, freenet (ETR:FNTN) looks quite promising in regards to its trends of return on capital.
Understanding Return On Capital Employed (ROCE)
For those that aren't sure what ROCE is, it measures the amount of pre-tax profits a company can generate from the capital employed in its business. Analysts use this formula to calculate it for freenet:
Return on Capital Employed = Earnings Before Interest and Tax (EBIT) ÷ (Total Assets - Current Liabilities)
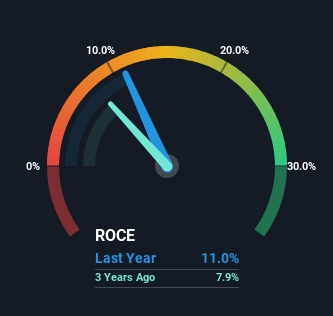
0.11 = €247m ÷ (€3.4b - €1.2b) (Based on the trailing twelve months to December 2023).
Thus, freenet has an ROCE of 11%. In absolute terms, that's a pretty normal return, and it's somewhat close to the Wireless Telecom industry average of 9.5%.
Check out our latest analysis for freenet
In the above chart we have measured freenet's prior ROCE against its prior performance, but the future is arguably more important. If you'd like, you can check out the forecasts from the analysts covering freenet for free.
What Does the ROCE Trend For freenet Tell Us?
You'd find it hard not to be impressed with the ROCE trend at freenet. We found that the returns on capital employed over the last five years have risen by 36%. The company is now earning €0.1 per dollar of capital employed. Interestingly, the business may be becoming more efficient because it's applying 36% less capital than it was five years ago. freenet may be selling some assets so it's worth investigating if the business has plans for future investments to increase returns further still.
On a side note, we noticed that the improvement in ROCE appears to be partly fueled by an increase in current liabilities. Effectively this means that suppliers or short-term creditors are now funding 34% of the business, which is more than it was five years ago. Keep an eye out for future increases because when the ratio of current liabilities to total assets gets particularly high, this can introduce some new risks for the business.
The Bottom Line On freenet's ROCE
From what we've seen above, freenet has managed to increase it's returns on capital all the while reducing it's capital base. Since the stock has returned a solid 75% to shareholders over the last five years, it's fair to say investors are beginning to recognize these changes. So given the stock has proven it has promising trends, it's worth researching the company further to see if these trends are likely to persist.
Like most companies, freenet does come with some risks, and we've found 1 warning sign that you should be aware of.
While freenet isn't earning the highest return, check out this free list of companies that are earning high returns on equity with solid balance sheets.
Have feedback on this article? Concerned about the content? Get in touch with us directly. Alternatively, email editorial-team (at) simplywallst.com.
This article by Simply Wall St is general in nature. We provide commentary based on historical data and analyst forecasts only using an unbiased methodology and our articles are not intended to be financial advice. It does not constitute a recommendation to buy or sell any stock, and does not take account of your objectives, or your financial situation. We aim to bring you long-term focused analysis driven by fundamental data. Note that our analysis may not factor in the latest price-sensitive company announcements or qualitative material. Simply Wall St has no position in any stocks mentioned.
