
 Yahoo Finance
 Returns Are Gaining Momentum At Gallant Venture (SGX:5IG)
What trends should we look for it we want to identify stocks that can multiply in value over the long term? Ideally, a business will show two trends; firstly a growing return on capital employed (ROCE) and secondly, an increasing amount of capital employed. Ultimately, this demonstrates that it's a business that is reinvesting profits at increasing rates of return. Speaking of which, we noticed some great changes in Gallant Venture's (SGX:5IG) returns on capital, so let's have a look.
Return On Capital Employed (ROCE): What Is It?
For those that aren't sure what ROCE is, it measures the amount of pre-tax profits a company can generate from the capital employed in its business. The formula for this calculation on Gallant Venture is:
Return on Capital Employed = Earnings Before Interest and Tax (EBIT) ÷ (Total Assets - Current Liabilities)
0.016 = S$19m ÷ (S$1.4b - S$195m) (Based on the trailing twelve months to June 2023).
Therefore, Gallant Venture has an ROCE of 1.6%. In absolute terms, that's a low return and it also under-performs the Integrated Utilities industry average of 5.2%.
See our latest analysis for Gallant Venture
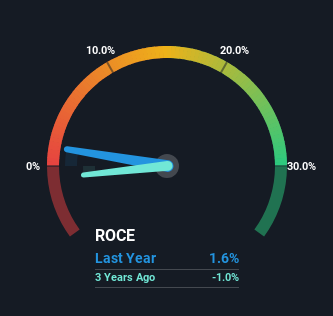
Historical performance is a great place to start when researching a stock so above you can see the gauge for Gallant Venture's ROCE against it's prior returns. If you're interested in investigating Gallant Venture's past further, check out this free graph of past earnings, revenue and cash flow.
How Are Returns Trending?
Even though ROCE is still low in absolute terms, it's good to see it's heading in the right direction. The data shows that returns on capital have increased by 155% over the trailing five years. That's a very favorable trend because this means that the company is earning more per dollar of capital that's being employed. Speaking of capital employed, the company is actually utilizing 57% less than it was five years ago, which can be indicative of a business that's improving its efficiency. Gallant Venture may be selling some assets so it's worth investigating if the business has plans for future investments to increase returns further still.
On a related note, the company's ratio of current liabilities to total assets has decreased to 14%, which basically reduces it's funding from the likes of short-term creditors or suppliers. Therefore we can rest assured that the growth in ROCE is a result of the business' fundamental improvements, rather than a cooking class featuring this company's books.
The Key Takeaway
From what we've seen above, Gallant Venture has managed to increase it's returns on capital all the while reducing it's capital base. Investors may not be impressed by the favorable underlying trends yet because over the last five years the stock has only returned 5.6% to shareholders. So exploring more about this stock could uncover a good opportunity, if the valuation and other metrics stack up.
While Gallant Venture looks impressive, no company is worth an infinite price. The intrinsic value infographic in our free research report helps visualize whether 5IG is currently trading for a fair price.
If you want to search for solid companies with great earnings, check out this free list of companies with good balance sheets and impressive returns on equity.
Have feedback on this article? Concerned about the content? Get in touch with us directly. Alternatively, email editorial-team (at) simplywallst.com.
This article by Simply Wall St is general in nature. We provide commentary based on historical data and analyst forecasts only using an unbiased methodology and our articles are not intended to be financial advice. It does not constitute a recommendation to buy or sell any stock, and does not take account of your objectives, or your financial situation. We aim to bring you long-term focused analysis driven by fundamental data. Note that our analysis may not factor in the latest price-sensitive company announcements or qualitative material. Simply Wall St has no position in any stocks mentioned.
