
 Yahoo Finance
 Returns Are Gaining Momentum At Kelt Exploration (TSE:KEL)
If we want to find a potential multi-bagger, often there are underlying trends that can provide clues. One common approach is to try and find a company with returns on capital employed (ROCE) that are increasing, in conjunction with a growing amount of capital employed. If you see this, it typically means it's a company with a great business model and plenty of profitable reinvestment opportunities. With that in mind, we've noticed some promising trends at Kelt Exploration (TSE:KEL) so let's look a bit deeper.
Return On Capital Employed (ROCE): What Is It?
If you haven't worked with ROCE before, it measures the 'return' (pre-tax profit) a company generates from capital employed in its business. The formula for this calculation on Kelt Exploration is:
Return on Capital Employed = Earnings Before Interest and Tax (EBIT) ÷ (Total Assets - Current Liabilities)
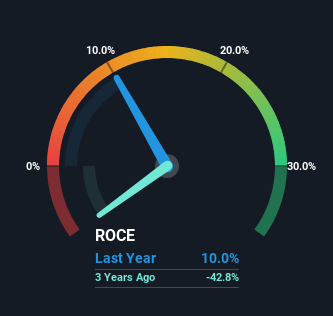
0.10 = CA$117m ÷ (CA$1.3b - CA$91m) (Based on the trailing twelve months to December 2023).
So, Kelt Exploration has an ROCE of 10%. That's a relatively normal return on capital, and it's around the 9.0% generated by the Oil and Gas industry.
Check out our latest analysis for Kelt Exploration
In the above chart we have measured Kelt Exploration's prior ROCE against its prior performance, but the future is arguably more important. If you'd like to see what analysts are forecasting going forward, you should check out our free analyst report for Kelt Exploration .
What Can We Tell From Kelt Exploration's ROCE Trend?
Kelt Exploration is showing promise given that its ROCE is trending up and to the right. The figures show that over the last five years, ROCE has grown 407% whilst employing roughly the same amount of capital. So our take on this is that the business has increased efficiencies to generate these higher returns, all the while not needing to make any additional investments. It's worth looking deeper into this though because while it's great that the business is more efficient, it might also mean that going forward the areas to invest internally for the organic growth are lacking.
The Bottom Line On Kelt Exploration's ROCE
In summary, we're delighted to see that Kelt Exploration has been able to increase efficiencies and earn higher rates of return on the same amount of capital. Considering the stock has delivered 9.1% to its stockholders over the last five years, it may be fair to think that investors aren't fully aware of the promising trends yet. So with that in mind, we think the stock deserves further research.
If you'd like to know about the risks facing Kelt Exploration, we've discovered 1 warning sign that you should be aware of.
While Kelt Exploration may not currently earn the highest returns, we've compiled a list of companies that currently earn more than 25% return on equity. Check out this free list here.
Have feedback on this article? Concerned about the content? Get in touch with us directly. Alternatively, email editorial-team (at) simplywallst.com.
This article by Simply Wall St is general in nature. We provide commentary based on historical data and analyst forecasts only using an unbiased methodology and our articles are not intended to be financial advice. It does not constitute a recommendation to buy or sell any stock, and does not take account of your objectives, or your financial situation. We aim to bring you long-term focused analysis driven by fundamental data. Note that our analysis may not factor in the latest price-sensitive company announcements or qualitative material. Simply Wall St has no position in any stocks mentioned.
