
 Yahoo Finance
 Returns Are Gaining Momentum At MedNation (FRA:EIF)
There are a few key trends to look for if we want to identify the next multi-bagger. Firstly, we'll want to see a proven return on capital employed (ROCE) that is increasing, and secondly, an expanding base of capital employed. If you see this, it typically means it's a company with a great business model and plenty of profitable reinvestment opportunities. Speaking of which, we noticed some great changes in MedNation's (FRA:EIF) returns on capital, so let's have a look.
Understanding Return On Capital Employed (ROCE)
For those who don't know, ROCE is a measure of a company's yearly pre-tax profit (its return), relative to the capital employed in the business. The formula for this calculation on MedNation is:
Return on Capital Employed = Earnings Before Interest and Tax (EBIT) ÷ (Total Assets - Current Liabilities)
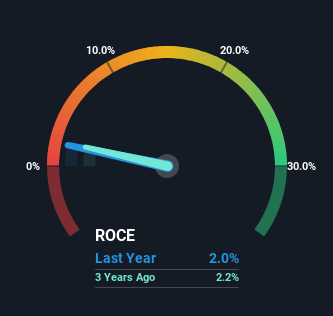
0.02 = €1.3m ÷ (€75m - €10m) (Based on the trailing twelve months to December 2022).
Thus, MedNation has an ROCE of 2.0%. Ultimately, that's a low return and it under-performs the Healthcare industry average of 5.2%.
View our latest analysis for MedNation
While the past is not representative of the future, it can be helpful to know how a company has performed historically, which is why we have this chart above. If you'd like to look at how MedNation has performed in the past in other metrics, you can view this free graph of past earnings, revenue and cash flow.
How Are Returns Trending?
We're glad to see that ROCE is heading in the right direction, even if it is still low at the moment. The numbers show that in the last five years, the returns generated on capital employed have grown considerably to 2.0%. The company is effectively making more money per dollar of capital used, and it's worth noting that the amount of capital has increased too, by 31%. The increasing returns on a growing amount of capital is common amongst multi-baggers and that's why we're impressed.
Our Take On MedNation's ROCE
In summary, it's great to see that MedNation can compound returns by consistently reinvesting capital at increasing rates of return, because these are some of the key ingredients of those highly sought after multi-baggers. Astute investors may have an opportunity here because the stock has declined 55% in the last five years. That being the case, research into the company's current valuation metrics and future prospects seems fitting.
If you want to continue researching MedNation, you might be interested to know about the 3 warning signs that our analysis has discovered.
If you want to search for solid companies with great earnings, check out this free list of companies with good balance sheets and impressive returns on equity.
Have feedback on this article? Concerned about the content? Get in touch with us directly. Alternatively, email editorial-team (at) simplywallst.com.
This article by Simply Wall St is general in nature. We provide commentary based on historical data and analyst forecasts only using an unbiased methodology and our articles are not intended to be financial advice. It does not constitute a recommendation to buy or sell any stock, and does not take account of your objectives, or your financial situation. We aim to bring you long-term focused analysis driven by fundamental data. Note that our analysis may not factor in the latest price-sensitive company announcements or qualitative material. Simply Wall St has no position in any stocks mentioned.
