
 Yahoo Finance
 Returns Are Gaining Momentum At Plan Optik (ETR:P4O)
To find a multi-bagger stock, what are the underlying trends we should look for in a business? Firstly, we'll want to see a proven return on capital employed (ROCE) that is increasing, and secondly, an expanding base of capital employed. Basically this means that a company has profitable initiatives that it can continue to reinvest in, which is a trait of a compounding machine. So on that note, Plan Optik (ETR:P4O) looks quite promising in regards to its trends of return on capital.
Return On Capital Employed (ROCE): What Is It?
If you haven't worked with ROCE before, it measures the 'return' (pre-tax profit) a company generates from capital employed in its business. Analysts use this formula to calculate it for Plan Optik:
Return on Capital Employed = Earnings Before Interest and Tax (EBIT) ÷ (Total Assets - Current Liabilities)
0.15 = €1.8m ÷ (€16m - €3.4m) (Based on the trailing twelve months to June 2023).
Thus, Plan Optik has an ROCE of 15%. In absolute terms, that's a pretty normal return, and it's somewhat close to the Semiconductor industry average of 16%.
View our latest analysis for Plan Optik
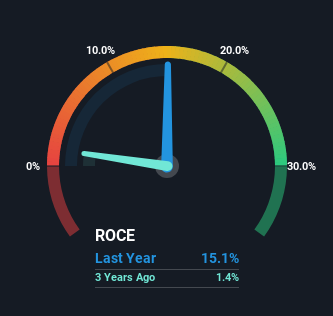
Historical performance is a great place to start when researching a stock so above you can see the gauge for Plan Optik's ROCE against it's prior returns. If you want to delve into the historical earnings , check out these free graphs detailing revenue and cash flow performance of Plan Optik.
What Does the ROCE Trend For Plan Optik Tell Us?
The trends we've noticed at Plan Optik are quite reassuring. The data shows that returns on capital have increased substantially over the last five years to 15%. The amount of capital employed has increased too, by 48%. This can indicate that there's plenty of opportunities to invest capital internally and at ever higher rates, a combination that's common among multi-baggers.
On a side note, we noticed that the improvement in ROCE appears to be partly fueled by an increase in current liabilities. The current liabilities has increased to 22% of total assets, so the business is now more funded by the likes of its suppliers or short-term creditors. Keep an eye out for future increases because when the ratio of current liabilities to total assets gets particularly high, this can introduce some new risks for the business.
The Bottom Line
All in all, it's terrific to see that Plan Optik is reaping the rewards from prior investments and is growing its capital base. Since the stock has returned a solid 84% to shareholders over the last five years, it's fair to say investors are beginning to recognize these changes. So given the stock has proven it has promising trends, it's worth researching the company further to see if these trends are likely to persist.
One more thing, we've spotted 3 warning signs facing Plan Optik that you might find interesting.
While Plan Optik isn't earning the highest return, check out this free list of companies that are earning high returns on equity with solid balance sheets.
Have feedback on this article? Concerned about the content? Get in touch with us directly. Alternatively, email editorial-team (at) simplywallst.com.
This article by Simply Wall St is general in nature. We provide commentary based on historical data and analyst forecasts only using an unbiased methodology and our articles are not intended to be financial advice. It does not constitute a recommendation to buy or sell any stock, and does not take account of your objectives, or your financial situation. We aim to bring you long-term focused analysis driven by fundamental data. Note that our analysis may not factor in the latest price-sensitive company announcements or qualitative material. Simply Wall St has no position in any stocks mentioned.
