
 Yahoo Finance
 Returns Are Gaining Momentum At Ta Ann Holdings Berhad (KLSE:TAANN)
If you're not sure where to start when looking for the next multi-bagger, there are a few key trends you should keep an eye out for. In a perfect world, we'd like to see a company investing more capital into its business and ideally the returns earned from that capital are also increasing. Put simply, these types of businesses are compounding machines, meaning they are continually reinvesting their earnings at ever-higher rates of return. So on that note, Ta Ann Holdings Berhad (KLSE:TAANN) looks quite promising in regards to its trends of return on capital.
Return On Capital Employed (ROCE): What Is It?
For those that aren't sure what ROCE is, it measures the amount of pre-tax profits a company can generate from the capital employed in its business. The formula for this calculation on Ta Ann Holdings Berhad is:
Return on Capital Employed = Earnings Before Interest and Tax (EBIT) ÷ (Total Assets - Current Liabilities)
0.12 = RM276m ÷ (RM2.7b - RM405m) (Based on the trailing twelve months to December 2023).
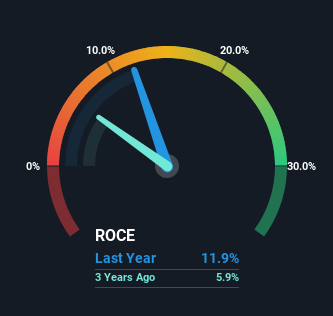
Therefore, Ta Ann Holdings Berhad has an ROCE of 12%. In absolute terms, that's a satisfactory return, but compared to the Food industry average of 7.5% it's much better.
View our latest analysis for Ta Ann Holdings Berhad
In the above chart we have measured Ta Ann Holdings Berhad's prior ROCE against its prior performance, but the future is arguably more important. If you'd like to see what analysts are forecasting going forward, you should check out our free analyst report for Ta Ann Holdings Berhad .
What Can We Tell From Ta Ann Holdings Berhad's ROCE Trend?
Ta Ann Holdings Berhad has not disappointed with their ROCE growth. More specifically, while the company has kept capital employed relatively flat over the last five years, the ROCE has climbed 142% in that same time. So our take on this is that the business has increased efficiencies to generate these higher returns, all the while not needing to make any additional investments. On that front, things are looking good so it's worth exploring what management has said about growth plans going forward.
The Key Takeaway
As discussed above, Ta Ann Holdings Berhad appears to be getting more proficient at generating returns since capital employed has remained flat but earnings (before interest and tax) are up. And a remarkable 140% total return over the last five years tells us that investors are expecting more good things to come in the future. Therefore, we think it would be worth your time to check if these trends are going to continue.
Like most companies, Ta Ann Holdings Berhad does come with some risks, and we've found 2 warning signs that you should be aware of.
For those who like to invest in solid companies, check out this free list of companies with solid balance sheets and high returns on equity.
Have feedback on this article? Concerned about the content? Get in touch with us directly. Alternatively, email editorial-team (at) simplywallst.com.
This article by Simply Wall St is general in nature. We provide commentary based on historical data and analyst forecasts only using an unbiased methodology and our articles are not intended to be financial advice. It does not constitute a recommendation to buy or sell any stock, and does not take account of your objectives, or your financial situation. We aim to bring you long-term focused analysis driven by fundamental data. Note that our analysis may not factor in the latest price-sensitive company announcements or qualitative material. Simply Wall St has no position in any stocks mentioned.
