
 Yahoo Finance
 Returns At Headlam Group (LON:HEAD) Appear To Be Weighed Down
What trends should we look for it we want to identify stocks that can multiply in value over the long term? Firstly, we'd want to identify a growing return on capital employed (ROCE) and then alongside that, an ever-increasing base of capital employed. This shows us that it's a compounding machine, able to continually reinvest its earnings back into the business and generate higher returns. Although, when we looked at Headlam Group (LON:HEAD), it didn't seem to tick all of these boxes.
Understanding Return On Capital Employed (ROCE)
For those who don't know, ROCE is a measure of a company's yearly pre-tax profit (its return), relative to the capital employed in the business. The formula for this calculation on Headlam Group is:
Return on Capital Employed = Earnings Before Interest and Tax (EBIT) ÷ (Total Assets - Current Liabilities)
0.16 = UK£40m ÷ (UK£463m - UK£210m) (Based on the trailing twelve months to June 2022).
So, Headlam Group has an ROCE of 16%. That's a relatively normal return on capital, and it's around the 14% generated by the Retail Distributors industry.
See our latest analysis for Headlam Group
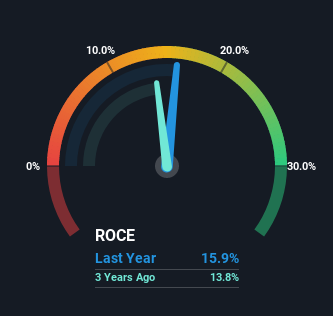
In the above chart we have measured Headlam Group's prior ROCE against its prior performance, but the future is arguably more important. If you'd like, you can check out the forecasts from the analysts covering Headlam Group here for free.
So How Is Headlam Group's ROCE Trending?
Over the past five years, Headlam Group's ROCE and capital employed have both remained mostly flat. It's not uncommon to see this when looking at a mature and stable business that isn't re-investing its earnings because it has likely passed that phase of the business cycle. So don't be surprised if Headlam Group doesn't end up being a multi-bagger in a few years time. This probably explains why Headlam Group is paying out 52% of its income to shareholders in the form of dividends. Unless businesses have highly compelling growth opportunities, they'll typically return some money to shareholders.
On a separate but related note, it's important to know that Headlam Group has a current liabilities to total assets ratio of 45%, which we'd consider pretty high. This effectively means that suppliers (or short-term creditors) are funding a large portion of the business, so just be aware that this can introduce some elements of risk. Ideally we'd like to see this reduce as that would mean fewer obligations bearing risks.
What We Can Learn From Headlam Group's ROCE
In a nutshell, Headlam Group has been trudging along with the same returns from the same amount of capital over the last five years. And in the last five years, the stock has given away 47% so the market doesn't look too hopeful on these trends strengthening any time soon. All in all, the inherent trends aren't typical of multi-baggers, so if that's what you're after, we think you might have more luck elsewhere.
Since virtually every company faces some risks, it's worth knowing what they are, and we've spotted 2 warning signs for Headlam Group (of which 1 is significant!) that you should know about.
While Headlam Group may not currently earn the highest returns, we've compiled a list of companies that currently earn more than 25% return on equity. Check out this free list here.
Have feedback on this article? Concerned about the content? Get in touch with us directly. Alternatively, email editorial-team (at) simplywallst.com.
This article by Simply Wall St is general in nature. We provide commentary based on historical data and analyst forecasts only using an unbiased methodology and our articles are not intended to be financial advice. It does not constitute a recommendation to buy or sell any stock, and does not take account of your objectives, or your financial situation. We aim to bring you long-term focused analysis driven by fundamental data. Note that our analysis may not factor in the latest price-sensitive company announcements or qualitative material. Simply Wall St has no position in any stocks mentioned.
Join A Paid User Research Session
You’ll receive a US$30 Amazon Gift card for 1 hour of your time while helping us build better investing tools for the individual investors like yourself. Sign up here
