
 Yahoo Finance
 What Do The Returns At Helios Towers (LON:HTWS) Mean Going Forward?
If we want to find a stock that could multiply over the long term, what are the underlying trends we should look for? Ideally, a business will show two trends; firstly a growing return on capital employed (ROCE) and secondly, an increasing amount of capital employed. Put simply, these types of businesses are compounding machines, meaning they are continually reinvesting their earnings at ever-higher rates of return. Speaking of which, we noticed some great changes in Helios Towers' (LON:HTWS) returns on capital, so let's have a look.
Understanding Return On Capital Employed (ROCE)
If you haven't worked with ROCE before, it measures the 'return' (pre-tax profit) a company generates from capital employed in its business. The formula for this calculation on Helios Towers is:
Return on Capital Employed = Earnings Before Interest and Tax (EBIT) ÷ (Total Assets - Current Liabilities)
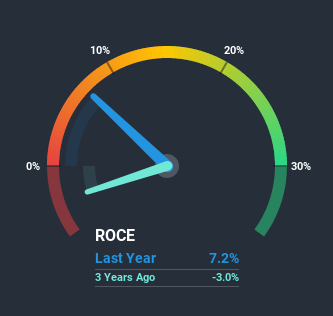
0.072 = US$67m ÷ (US$1.2b - US$224m) (Based on the trailing twelve months to June 2020).
So, Helios Towers has an ROCE of 7.2%. On its own that's a low return on capital but it's in line with the industry's average returns of 7.4%.
View our latest analysis for Helios Towers
Above you can see how the current ROCE for Helios Towers compares to its prior returns on capital, but there's only so much you can tell from the past. If you'd like, you can check out the forecasts from the analysts covering Helios Towers here for free.
What Does the ROCE Trend For Helios Towers Tell Us?
Shareholders will be relieved that Helios Towers has broken into profitability. While the business was unprofitable in the past, it's now turned things around and is earning 7.2% on its capital. On top of that, what's interesting is that the amount of capital being employed has remained steady, so the business hasn't needed to put any additional money to work to generate these higher returns. So while we're happy that the business is more efficient, just keep in mind that could mean that going forward the business is lacking areas to invest internally for growth. After all, a company can only become a long term multi-bagger if it continually reinvests in itself at high rates of return.
The Bottom Line On Helios Towers' ROCE
To bring it all together, Helios Towers has done well to increase the returns it's generating from its capital employed. And with a respectable 27% awarded to those who held the stock over the last year, you could argue that these trends are starting to get the attention they deserve. Therefore, we think it would be worth your time to check if these trends are going to continue.
On the other side of ROCE, we have to consider valuation. That's why we have a FREE intrinsic value estimation on our platform that is definitely worth checking out.
While Helios Towers may not currently earn the highest returns, we've compiled a list of companies that currently earn more than 25% return on equity. Check out this free list here.
This article by Simply Wall St is general in nature. It does not constitute a recommendation to buy or sell any stock, and does not take account of your objectives, or your financial situation. We aim to bring you long-term focused analysis driven by fundamental data. Note that our analysis may not factor in the latest price-sensitive company announcements or qualitative material. Simply Wall St has no position in any stocks mentioned.
Have feedback on this article? Concerned about the content? Get in touch with us directly. Alternatively, email editorial-team@simplywallst.com.
