
 Yahoo Finance
 Returns At Imperial Brands (LON:IMB) Are On The Way Up
To find a multi-bagger stock, what are the underlying trends we should look for in a business? Firstly, we'll want to see a proven return on capital employed (ROCE) that is increasing, and secondly, an expanding base of capital employed. If you see this, it typically means it's a company with a great business model and plenty of profitable reinvestment opportunities. So on that note, Imperial Brands (LON:IMB) looks quite promising in regards to its trends of return on capital.
Understanding Return On Capital Employed (ROCE)
For those who don't know, ROCE is a measure of a company's yearly pre-tax profit (its return), relative to the capital employed in the business. To calculate this metric for Imperial Brands, this is the formula:
Return on Capital Employed = Earnings Before Interest and Tax (EBIT) ÷ (Total Assets - Current Liabilities)
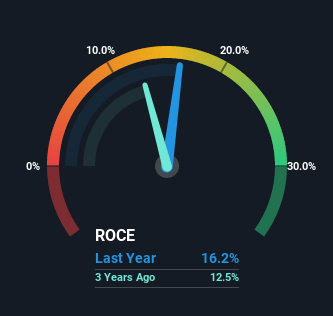
0.16 = UK£3.2b ÷ (UK£31b - UK£11b) (Based on the trailing twelve months to September 2022).
Therefore, Imperial Brands has an ROCE of 16%. In absolute terms, that's a pretty normal return, and it's somewhat close to the Tobacco industry average of 14%.
See our latest analysis for Imperial Brands
In the above chart we have measured Imperial Brands' prior ROCE against its prior performance, but the future is arguably more important. If you'd like to see what analysts are forecasting going forward, you should check out our free report for Imperial Brands.
So How Is Imperial Brands' ROCE Trending?
Imperial Brands has not disappointed with their ROCE growth. The figures show that over the last five years, ROCE has grown 23% whilst employing roughly the same amount of capital. So our take on this is that the business has increased efficiencies to generate these higher returns, all the while not needing to make any additional investments. The company is doing well in that sense, and it's worth investigating what the management team has planned for long term growth prospects.
The Bottom Line
In summary, we're delighted to see that Imperial Brands has been able to increase efficiencies and earn higher rates of return on the same amount of capital. Investors may not be impressed by the favorable underlying trends yet because over the last five years the stock has only returned 3.1% to shareholders. Given that, we'd look further into this stock in case it has more traits that could make it multiply in the long term.
Imperial Brands does have some risks though, and we've spotted 3 warning signs for Imperial Brands that you might be interested in.
While Imperial Brands may not currently earn the highest returns, we've compiled a list of companies that currently earn more than 25% return on equity. Check out this free list here.
Have feedback on this article? Concerned about the content? Get in touch with us directly. Alternatively, email editorial-team (at) simplywallst.com.
This article by Simply Wall St is general in nature. We provide commentary based on historical data and analyst forecasts only using an unbiased methodology and our articles are not intended to be financial advice. It does not constitute a recommendation to buy or sell any stock, and does not take account of your objectives, or your financial situation. We aim to bring you long-term focused analysis driven by fundamental data. Note that our analysis may not factor in the latest price-sensitive company announcements or qualitative material. Simply Wall St has no position in any stocks mentioned.
Join A Paid User Research Session
You’ll receive a US$30 Amazon Gift card for 1 hour of your time while helping us build better investing tools for the individual investors like yourself. Sign up here
