
 Yahoo Finance
 Returns At Jaywing (LON:JWNG) Are On The Way Up
There are a few key trends to look for if we want to identify the next multi-bagger. Amongst other things, we'll want to see two things; firstly, a growing return on capital employed (ROCE) and secondly, an expansion in the company's amount of capital employed. Put simply, these types of businesses are compounding machines, meaning they are continually reinvesting their earnings at ever-higher rates of return. So when we looked at Jaywing (LON:JWNG) and its trend of ROCE, we really liked what we saw.
Understanding Return On Capital Employed (ROCE)
For those who don't know, ROCE is a measure of a company's yearly pre-tax profit (its return), relative to the capital employed in the business. To calculate this metric for Jaywing, this is the formula:
Return on Capital Employed = Earnings Before Interest and Tax (EBIT) ÷ (Total Assets - Current Liabilities)
0.016 = UK£289k ÷ (UK£36m - UK£19m) (Based on the trailing twelve months to September 2022).
Therefore, Jaywing has an ROCE of 1.6%. Ultimately, that's a low return and it under-performs the Media industry average of 11%.
See our latest analysis for Jaywing
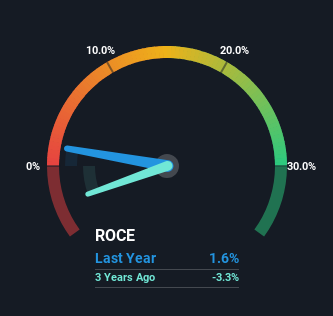
Above you can see how the current ROCE for Jaywing compares to its prior returns on capital, but there's only so much you can tell from the past. If you'd like to see what analysts are forecasting going forward, you should check out our free report for Jaywing.
What Can We Tell From Jaywing's ROCE Trend?
Like most people, we're pleased that Jaywing is now generating some pretax earnings. The company was generating losses five years ago, but now it's turned around, earning 1.6% which is no doubt a relief for some early shareholders. Additionally, the business is utilizing 53% less capital than it was five years ago, and taken at face value, that can mean the company needs less funds at work to get a return. Jaywing could be selling under-performing assets since the ROCE is improving.
On a side note, we noticed that the improvement in ROCE appears to be partly fueled by an increase in current liabilities. The current liabilities has increased to 52% of total assets, so the business is now more funded by the likes of its suppliers or short-term creditors. And with current liabilities at those levels, that's pretty high.
Our Take On Jaywing's ROCE
In a nutshell, we're pleased to see that Jaywing has been able to generate higher returns from less capital. However the stock is down a substantial 78% in the last five years so there could be other areas of the business hurting its prospects. Regardless, we think the underlying fundamentals warrant this stock for further investigation.
Jaywing does have some risks, we noticed 2 warning signs (and 1 which shouldn't be ignored) we think you should know about.
While Jaywing isn't earning the highest return, check out this free list of companies that are earning high returns on equity with solid balance sheets.
Have feedback on this article? Concerned about the content? Get in touch with us directly. Alternatively, email editorial-team (at) simplywallst.com.
This article by Simply Wall St is general in nature. We provide commentary based on historical data and analyst forecasts only using an unbiased methodology and our articles are not intended to be financial advice. It does not constitute a recommendation to buy or sell any stock, and does not take account of your objectives, or your financial situation. We aim to bring you long-term focused analysis driven by fundamental data. Note that our analysis may not factor in the latest price-sensitive company announcements or qualitative material. Simply Wall St has no position in any stocks mentioned.
Join A Paid User Research Session
You’ll receive a US$30 Amazon Gift card for 1 hour of your time while helping us build better investing tools for the individual investors like yourself. Sign up here
