
 Yahoo Finance
 The Returns At Luxking Group Holdings (SGX:BKK) Aren't Growing
There are a few key trends to look for if we want to identify the next multi-bagger. In a perfect world, we'd like to see a company investing more capital into its business and ideally the returns earned from that capital are also increasing. Ultimately, this demonstrates that it's a business that is reinvesting profits at increasing rates of return. However, after investigating Luxking Group Holdings (SGX:BKK), we don't think it's current trends fit the mold of a multi-bagger.
What Is Return On Capital Employed (ROCE)?
If you haven't worked with ROCE before, it measures the 'return' (pre-tax profit) a company generates from capital employed in its business. Analysts use this formula to calculate it for Luxking Group Holdings:
Return on Capital Employed = Earnings Before Interest and Tax (EBIT) ÷ (Total Assets - Current Liabilities)
0.059 = CN¥8.0m ÷ (CN¥304m - CN¥168m) (Based on the trailing twelve months to June 2022).
Thus, Luxking Group Holdings has an ROCE of 5.9%. Even though it's in line with the industry average of 5.9%, it's still a low return by itself.
Check out our latest analysis for Luxking Group Holdings
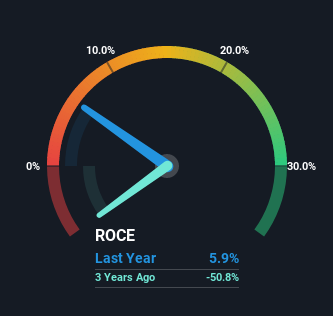
Historical performance is a great place to start when researching a stock so above you can see the gauge for Luxking Group Holdings' ROCE against it's prior returns. If you'd like to look at how Luxking Group Holdings has performed in the past in other metrics, you can view this free graph of past earnings, revenue and cash flow.
What The Trend Of ROCE Can Tell Us
Over the past five years, Luxking Group Holdings' ROCE has remained relatively flat while the business is using 37% less capital than before. To us that doesn't look like a multi-bagger because the company appears to be selling assets and it's returns aren't increasing. Not only that, but the low returns on this capital mentioned earlier would leave most investors unimpressed.
Another point to note, we noticed the company has increased current liabilities over the last five years. This is intriguing because if current liabilities hadn't increased to 55% of total assets, this reported ROCE would probably be less than5.9% because total capital employed would be higher.The 5.9% ROCE could be even lower if current liabilities weren't 55% of total assets, because the the formula would show a larger base of total capital employed. Additionally, this high level of current liabilities isn't ideal because it means the company's suppliers (or short-term creditors) are effectively funding a large portion of the business.
What We Can Learn From Luxking Group Holdings' ROCE
It's a shame to see that Luxking Group Holdings is effectively shrinking in terms of its capital base. Since the stock has declined 55% over the last five years, investors may not be too optimistic on this trend improving either. In any case, the stock doesn't have these traits of a multi-bagger discussed above, so if that's what you're looking for, we think you'd have more luck elsewhere.
On a final note, we found 4 warning signs for Luxking Group Holdings (3 don't sit too well with us) you should be aware of.
If you want to search for solid companies with great earnings, check out this free list of companies with good balance sheets and impressive returns on equity.
Have feedback on this article? Concerned about the content? Get in touch with us directly. Alternatively, email editorial-team (at) simplywallst.com.
This article by Simply Wall St is general in nature. We provide commentary based on historical data and analyst forecasts only using an unbiased methodology and our articles are not intended to be financial advice. It does not constitute a recommendation to buy or sell any stock, and does not take account of your objectives, or your financial situation. We aim to bring you long-term focused analysis driven by fundamental data. Note that our analysis may not factor in the latest price-sensitive company announcements or qualitative material. Simply Wall St has no position in any stocks mentioned.
Join A Paid User Research Session
You’ll receive a US$30 Amazon Gift card for 1 hour of your time while helping us build better investing tools for the individual investors like yourself. Sign up here
