
 Yahoo Finance
 The Returns At Mission Group (LON:TMG) Provide Us With Signs Of What's To Come

If you're looking for a multi-bagger, there's a few things to keep an eye out for. Typically, we'll want to notice a trend of growing return on capital employed (ROCE) and alongside that, an expanding base of capital employed. Put simply, these types of businesses are compounding machines, meaning they are continually reinvesting their earnings at ever-higher rates of return. Having said that, from a first glance at Mission Group (LON:TMG) we aren't jumping out of our chairs at how returns are trending, but let's have a deeper look.
What is Return On Capital Employed (ROCE)?
Just to clarify if you're unsure, ROCE is a metric for evaluating how much pre-tax income (in percentage terms) a company earns on the capital invested in its business. Analysts use this formula to calculate it for Mission Group:
Return on Capital Employed = Earnings Before Interest and Tax (EBIT) ÷ (Total Assets - Current Liabilities)
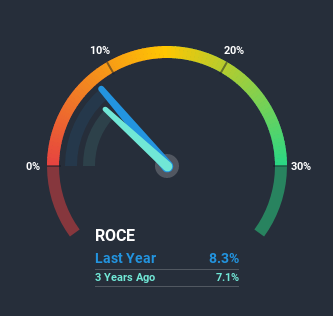
0.083 = UK£9.5m ÷ (UK£155m - UK£40m) (Based on the trailing twelve months to December 2019).
Thus, Mission Group has an ROCE of 8.3%. In absolute terms, that's a low return but it's around the Media industry average of 8.7%.
View our latest analysis for Mission Group
Above you can see how the current ROCE for Mission Group compares to its prior returns on capital, but there's only so much you can tell from the past. If you'd like, you can check out the forecasts from the analysts covering Mission Group here for free.
The Trend Of ROCE
In terms of Mission Group's historical ROCE trend, it doesn't exactly demand attention. The company has consistently earned 8.3% for the last five years, and the capital employed within the business has risen 54% in that time. Given the company has increased the amount of capital employed, it appears the investments that have been made simply don't provide a high return on capital.
The Bottom Line On Mission Group's ROCE
Long story short, while Mission Group has been reinvesting its capital, the returns that it's generating haven't increased. Since the stock has gained an impressive 62% over the last five years, investors must think there's better things to come. Ultimately, if the underlying trends persist, we wouldn't hold our breath on it being a multi-bagger going forward.
If you'd like to know about the risks facing Mission Group, we've discovered 3 warning signs that you should be aware of.
While Mission Group may not currently earn the highest returns, we've compiled a list of companies that currently earn more than 25% return on equity. Check out this free list here.
This article by Simply Wall St is general in nature. It does not constitute a recommendation to buy or sell any stock, and does not take account of your objectives, or your financial situation. We aim to bring you long-term focused analysis driven by fundamental data. Note that our analysis may not factor in the latest price-sensitive company announcements or qualitative material. Simply Wall St has no position in any stocks mentioned.
Have feedback on this article? Concerned about the content? Get in touch with us directly. Alternatively, email editorial-team@simplywallst.com.
