
 Yahoo Finance
 Returns At Monash IVF Group (ASX:MVF) Appear To Be Weighed Down
If we want to find a potential multi-bagger, often there are underlying trends that can provide clues. Firstly, we'll want to see a proven return on capital employed (ROCE) that is increasing, and secondly, an expanding base of capital employed. Put simply, these types of businesses are compounding machines, meaning they are continually reinvesting their earnings at ever-higher rates of return. So, when we ran our eye over Monash IVF Group's (ASX:MVF) trend of ROCE, we liked what we saw.
Return On Capital Employed (ROCE): What Is It?
For those who don't know, ROCE is a measure of a company's yearly pre-tax profit (its return), relative to the capital employed in the business. To calculate this metric for Monash IVF Group, this is the formula:
Return on Capital Employed = Earnings Before Interest and Tax (EBIT) ÷ (Total Assets - Current Liabilities)
0.11 = AU$39m ÷ (AU$450m - AU$92m) (Based on the trailing twelve months to December 2023).
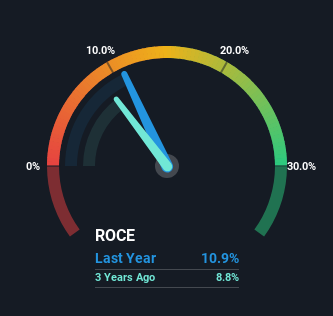
Therefore, Monash IVF Group has an ROCE of 11%. On its own, that's a standard return, however it's much better than the 6.4% generated by the Healthcare industry.
Check out our latest analysis for Monash IVF Group
In the above chart we have measured Monash IVF Group's prior ROCE against its prior performance, but the future is arguably more important. If you'd like to see what analysts are forecasting going forward, you should check out our free analyst report for Monash IVF Group .
So How Is Monash IVF Group's ROCE Trending?
While the current returns on capital are decent, they haven't changed much. The company has consistently earned 11% for the last five years, and the capital employed within the business has risen 34% in that time. Since 11% is a moderate ROCE though, it's good to see a business can continue to reinvest at these decent rates of return. Stable returns in this ballpark can be unexciting, but if they can be maintained over the long run, they often provide nice rewards to shareholders.
Another point to note, we noticed the company has increased current liabilities over the last five years. This is intriguing because if current liabilities hadn't increased to 20% of total assets, this reported ROCE would probably be less than11% because total capital employed would be higher.The 11% ROCE could be even lower if current liabilities weren't 20% of total assets, because the the formula would show a larger base of total capital employed. With that in mind, just be wary if this ratio increases in the future, because if it gets particularly high, this brings with it some new elements of risk.
The Bottom Line
The main thing to remember is that Monash IVF Group has proven its ability to continually reinvest at respectable rates of return. And the stock has followed suit returning a meaningful 77% to shareholders over the last five years. So while the positive underlying trends may be accounted for by investors, we still think this stock is worth looking into further.
On a separate note, we've found 1 warning sign for Monash IVF Group you'll probably want to know about.
If you want to search for solid companies with great earnings, check out this free list of companies with good balance sheets and impressive returns on equity.
Have feedback on this article? Concerned about the content? Get in touch with us directly. Alternatively, email editorial-team (at) simplywallst.com.
This article by Simply Wall St is general in nature. We provide commentary based on historical data and analyst forecasts only using an unbiased methodology and our articles are not intended to be financial advice. It does not constitute a recommendation to buy or sell any stock, and does not take account of your objectives, or your financial situation. We aim to bring you long-term focused analysis driven by fundamental data. Note that our analysis may not factor in the latest price-sensitive company announcements or qualitative material. Simply Wall St has no position in any stocks mentioned.
