
 Yahoo Finance
 Returns At MyHealthChecked (LON:MHC) Are On The Way Up
If we want to find a stock that could multiply over the long term, what are the underlying trends we should look for? One common approach is to try and find a company with returns on capital employed (ROCE) that are increasing, in conjunction with a growing amount of capital employed. If you see this, it typically means it's a company with a great business model and plenty of profitable reinvestment opportunities. So when we looked at MyHealthChecked (LON:MHC) and its trend of ROCE, we really liked what we saw.
Understanding Return On Capital Employed (ROCE)
If you haven't worked with ROCE before, it measures the 'return' (pre-tax profit) a company generates from capital employed in its business. The formula for this calculation on MyHealthChecked is:
Return on Capital Employed = Earnings Before Interest and Tax (EBIT) ÷ (Total Assets - Current Liabilities)
0.14 = UK£1.2m ÷ (UK£10m - UK£1.6m) (Based on the trailing twelve months to June 2023).
Thus, MyHealthChecked has an ROCE of 14%. On its own, that's a standard return, however it's much better than the 8.7% generated by the Medical Equipment industry.
View our latest analysis for MyHealthChecked
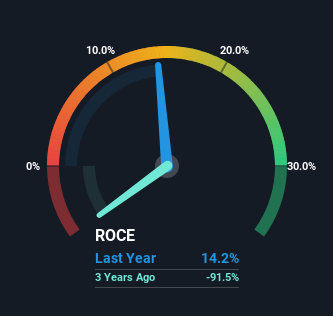
Historical performance is a great place to start when researching a stock so above you can see the gauge for MyHealthChecked's ROCE against it's prior returns. If you're interested in investigating MyHealthChecked's past further, check out this free graph of past earnings, revenue and cash flow.
How Are Returns Trending?
We're delighted to see that MyHealthChecked is reaping rewards from its investments and is now generating some pre-tax profits. About five years ago the company was generating losses but things have turned around because it's now earning 14% on its capital. And unsurprisingly, like most companies trying to break into the black, MyHealthChecked is utilizing 398% more capital than it was five years ago. This can tell us that the company has plenty of reinvestment opportunities that are able to generate higher returns.
What We Can Learn From MyHealthChecked's ROCE
Long story short, we're delighted to see that MyHealthChecked's reinvestment activities have paid off and the company is now profitable. And since the stock has dived 73% over the last five years, there may be other factors affecting the company's prospects. Still, it's worth doing some further research to see if the trends will continue into the future.
MyHealthChecked does have some risks, we noticed 4 warning signs (and 2 which are significant) we think you should know about.
If you want to search for solid companies with great earnings, check out this free list of companies with good balance sheets and impressive returns on equity.
Have feedback on this article? Concerned about the content? Get in touch with us directly. Alternatively, email editorial-team (at) simplywallst.com.
This article by Simply Wall St is general in nature. We provide commentary based on historical data and analyst forecasts only using an unbiased methodology and our articles are not intended to be financial advice. It does not constitute a recommendation to buy or sell any stock, and does not take account of your objectives, or your financial situation. We aim to bring you long-term focused analysis driven by fundamental data. Note that our analysis may not factor in the latest price-sensitive company announcements or qualitative material. Simply Wall St has no position in any stocks mentioned.
