
 Yahoo Finance
 Returns At Ocean Wilsons Holdings (LON:OCN) Appear To Be Weighed Down
What trends should we look for it we want to identify stocks that can multiply in value over the long term? One common approach is to try and find a company with returns on capital employed (ROCE) that are increasing, in conjunction with a growing amount of capital employed. Ultimately, this demonstrates that it's a business that is reinvesting profits at increasing rates of return. However, after briefly looking over the numbers, we don't think Ocean Wilsons Holdings (LON:OCN) has the makings of a multi-bagger going forward, but let's have a look at why that may be.
Understanding Return On Capital Employed (ROCE)
If you haven't worked with ROCE before, it measures the 'return' (pre-tax profit) a company generates from capital employed in its business. To calculate this metric for Ocean Wilsons Holdings, this is the formula:
Return on Capital Employed = Earnings Before Interest and Tax (EBIT) ÷ (Total Assets - Current Liabilities)
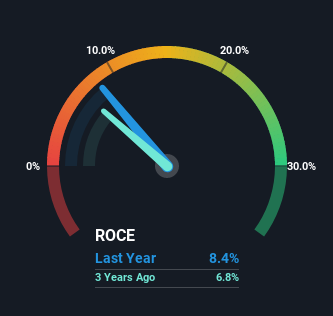
0.084 = US$102m ÷ (US$1.4b - US$138m) (Based on the trailing twelve months to June 2022).
Thus, Ocean Wilsons Holdings has an ROCE of 8.4%. Even though it's in line with the industry average of 8.4%, it's still a low return by itself.
See our latest analysis for Ocean Wilsons Holdings
Above you can see how the current ROCE for Ocean Wilsons Holdings compares to its prior returns on capital, but there's only so much you can tell from the past. If you'd like, you can check out the forecasts from the analysts covering Ocean Wilsons Holdings here for free.
So How Is Ocean Wilsons Holdings' ROCE Trending?
Things have been pretty stable at Ocean Wilsons Holdings, with its capital employed and returns on that capital staying somewhat the same for the last five years. Businesses with these traits tend to be mature and steady operations because they're past the growth phase. With that in mind, unless investment picks up again in the future, we wouldn't expect Ocean Wilsons Holdings to be a multi-bagger going forward. With fewer investment opportunities, it makes sense that Ocean Wilsons Holdings has been paying out a decent 49% of its earnings to shareholders. Given the business isn't reinvesting in itself, it makes sense to distribute a portion of earnings among shareholders.
The Bottom Line
In a nutshell, Ocean Wilsons Holdings has been trudging along with the same returns from the same amount of capital over the last five years. Unsurprisingly, the stock has only gained 22% over the last five years, which potentially indicates that investors are accounting for this going forward. As a result, if you're hunting for a multi-bagger, we think you'd have more luck elsewhere.
On a final note, we've found 2 warning signs for Ocean Wilsons Holdings that we think you should be aware of.
While Ocean Wilsons Holdings isn't earning the highest return, check out this free list of companies that are earning high returns on equity with solid balance sheets.
Have feedback on this article? Concerned about the content? Get in touch with us directly. Alternatively, email editorial-team (at) simplywallst.com.
This article by Simply Wall St is general in nature. We provide commentary based on historical data and analyst forecasts only using an unbiased methodology and our articles are not intended to be financial advice. It does not constitute a recommendation to buy or sell any stock, and does not take account of your objectives, or your financial situation. We aim to bring you long-term focused analysis driven by fundamental data. Note that our analysis may not factor in the latest price-sensitive company announcements or qualitative material. Simply Wall St has no position in any stocks mentioned.
Join A Paid User Research Session
You’ll receive a US$30 Amazon Gift card for 1 hour of your time while helping us build better investing tools for the individual investors like yourself. Sign up here
