
 Yahoo Finance
 Returns At Strategic Minerals (LON:SML) Are On The Way Up
Did you know there are some financial metrics that can provide clues of a potential multi-bagger? Typically, we'll want to notice a trend of growing return on capital employed (ROCE) and alongside that, an expanding base of capital employed. Put simply, these types of businesses are compounding machines, meaning they are continually reinvesting their earnings at ever-higher rates of return. With that in mind, we've noticed some promising trends at Strategic Minerals (LON:SML) so let's look a bit deeper.
Understanding Return On Capital Employed (ROCE)
For those that aren't sure what ROCE is, it measures the amount of pre-tax profits a company can generate from the capital employed in its business. The formula for this calculation on Strategic Minerals is:
Return on Capital Employed = Earnings Before Interest and Tax (EBIT) ÷ (Total Assets - Current Liabilities)
0.033 = US$461k ÷ (US$15m - US$474k) (Based on the trailing twelve months to June 2021).
So, Strategic Minerals has an ROCE of 3.3%. Ultimately, that's a low return and it under-performs the Metals and Mining industry average of 15%.
View our latest analysis for Strategic Minerals
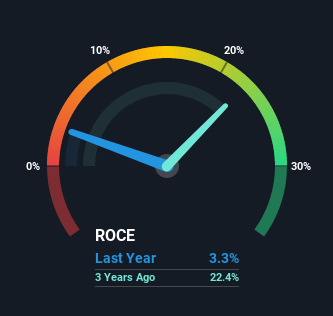
Historical performance is a great place to start when researching a stock so above you can see the gauge for Strategic Minerals' ROCE against it's prior returns. If you'd like to look at how Strategic Minerals has performed in the past in other metrics, you can view this free graph of past earnings, revenue and cash flow.
The Trend Of ROCE
We're delighted to see that Strategic Minerals is reaping rewards from its investments and is now generating some pre-tax profits. The company was generating losses five years ago, but now it's earning 3.3% which is a sight for sore eyes. In addition to that, Strategic Minerals is employing 1,036% more capital than previously which is expected of a company that's trying to break into profitability. This can indicate that there's plenty of opportunities to invest capital internally and at ever higher rates, both common traits of a multi-bagger.
In another part of our analysis, we noticed that the company's ratio of current liabilities to total assets decreased to 3.3%, which broadly means the business is relying less on its suppliers or short-term creditors to fund its operations. So shareholders would be pleased that the growth in returns has mostly come from underlying business performance.
The Bottom Line On Strategic Minerals' ROCE
In summary, it's great to see that Strategic Minerals has managed to break into profitability and is continuing to reinvest in its business. And since the stock has dived 75% over the last five years, there may be other factors affecting the company's prospects. In any case, we believe the economic trends of this company are positive and looking into the stock further could prove rewarding.
One more thing: We've identified 5 warning signs with Strategic Minerals (at least 1 which shouldn't be ignored) , and understanding these would certainly be useful.
While Strategic Minerals may not currently earn the highest returns, we've compiled a list of companies that currently earn more than 25% return on equity. Check out this free list here.
Have feedback on this article? Concerned about the content? Get in touch with us directly. Alternatively, email editorial-team (at) simplywallst.com.
This article by Simply Wall St is general in nature. We provide commentary based on historical data and analyst forecasts only using an unbiased methodology and our articles are not intended to be financial advice. It does not constitute a recommendation to buy or sell any stock, and does not take account of your objectives, or your financial situation. We aim to bring you long-term focused analysis driven by fundamental data. Note that our analysis may not factor in the latest price-sensitive company announcements or qualitative material. Simply Wall St has no position in any stocks mentioned.
